
Who will win the 2020 UC election?
We ran the numbers. Here’s what we found.
Election season is in full swing at Harvard, and with it comes HODP’s annual data-driven coverage on the state of the horse race.
There are two official tickets (and a cat) vying to lead the Harvard UC this year: Noah Harris (Dunster ‘22) & Jenny Gan (Leverett ‘22) and Mini Ganesh (Eliot ‘22) & Nicholas Brennan (Winthrop ‘23). This is by far the smallest field of candidates in recent UC election history, perhaps because it’s being held immediately after a contentious U.S. presidential election, and with only 32 percent of enrolled students learning and living on campus this semester. In fact, we expect this year’s election to have particularly low student turnout, constrained not only by how many students are eligible to vote, but by the historical trend that as fewer people run, fewer people vote.
Ticket Composition
There are structural advantages to note that have helped campaigns succeed in past years — the two most significant being established UC experience and a junior-junior ticket.
Experience matters.
HODP’s analysis of past successful campaigns indicate insider-insider tickets win 92.8 percent of the time — the only exception being Samuel Clark’s outsider campaign in 2013. Both tickets this year have established experience in the UC — Noah is the UC Treasurer, while Mini serves as the UC Finance Chair — and have indeed run their campaigns on the respective initiatives they’ve put in place on the council.
Juniors tend to win.
Mini & Nick are the only inter-class ticket on the ballot, a self-described advantage that allows the ticket to “accurately represent the student body.” However, every elected ticket has been a junior-junior pair since 2007, and we expect this year to pan out similarly.
It’s important to note that these advantages are not guaranteed to hold true each year. Last year, Aditya Dhar & Andrew Liang — who both have no UC experience and ran their campaign on abolishing the UC — came within a hair of the presidency, receiving the most first-choice votes of any ticket on that year’s ballot.
Social Media and Endorsements
The unprecedented nature of this race likely places more weight on each ticket’s online presence — the only strategy for candidates to engage students not on campus. We also learned from last year’s prediction that a successful social media strategy can turn out students who otherwise would not have voted, in the case of James & Ify’s viral campaign video. Like in past years, one ticket — Noah & Jenny — became early frontrunners, raking in likes, followers, and endorsements across their online platforms. The ticket has received fifteen endorsements so far — including from many key cultural and affinity organizations — as well as the most support from current UC members. Based on straightforward metrics, Noah & Jenny’s combined 1,253 likes across their Facebook and Instagram pages — compared to Mini & Nick’s 172 — indicate a sizable lead in online reach and engagement.
Our poll
Under the Dowdall method of the Borda system, which is what the UC now uses, voters award the first-choice candidate 1 point, while the second-choice candidate receives ½ a point. This system is favorable to candidates with many first preferences, but is also vulnerable to strategic voting. For instance, early frontrunners Sanika & Rushi received the most fifth place votes of any ticket in the 2019 election — perhaps a case of supporters of other candidates strategically voting Sanika & Rushi last, even if it did not accurately represent their preferences.
We conducted a poll from Monday, 12 PM EDT to Wednesday, 11:59 PM EDT, the day before the end of voting. We received 208 unique responses after removing duplicates (yes, we could tell.) Though this sample falls just short of 10 percent of last year’s turnout — a rule of thumb in sampling for a population — we also cannot confirm the level of turnout this year compared to previous years. Moreover, we believe this sample is representative when it comes to potential non-response bias — students who respond to our poll are most likely to vote in the election. We also expect that there will be no opportunity to vote strategically in a two-candidate race.
An important caveat
Our poll was open to both enrollees and students on leave — who are ineligible to vote — to respond. With the latter comprising a fifth of the student body this semester, this presents another potential bias in our data if students on leave are systematically different in how they will vote in the election. Though this reduces how robust our data is, we analyze the probability of an upset based on this below.

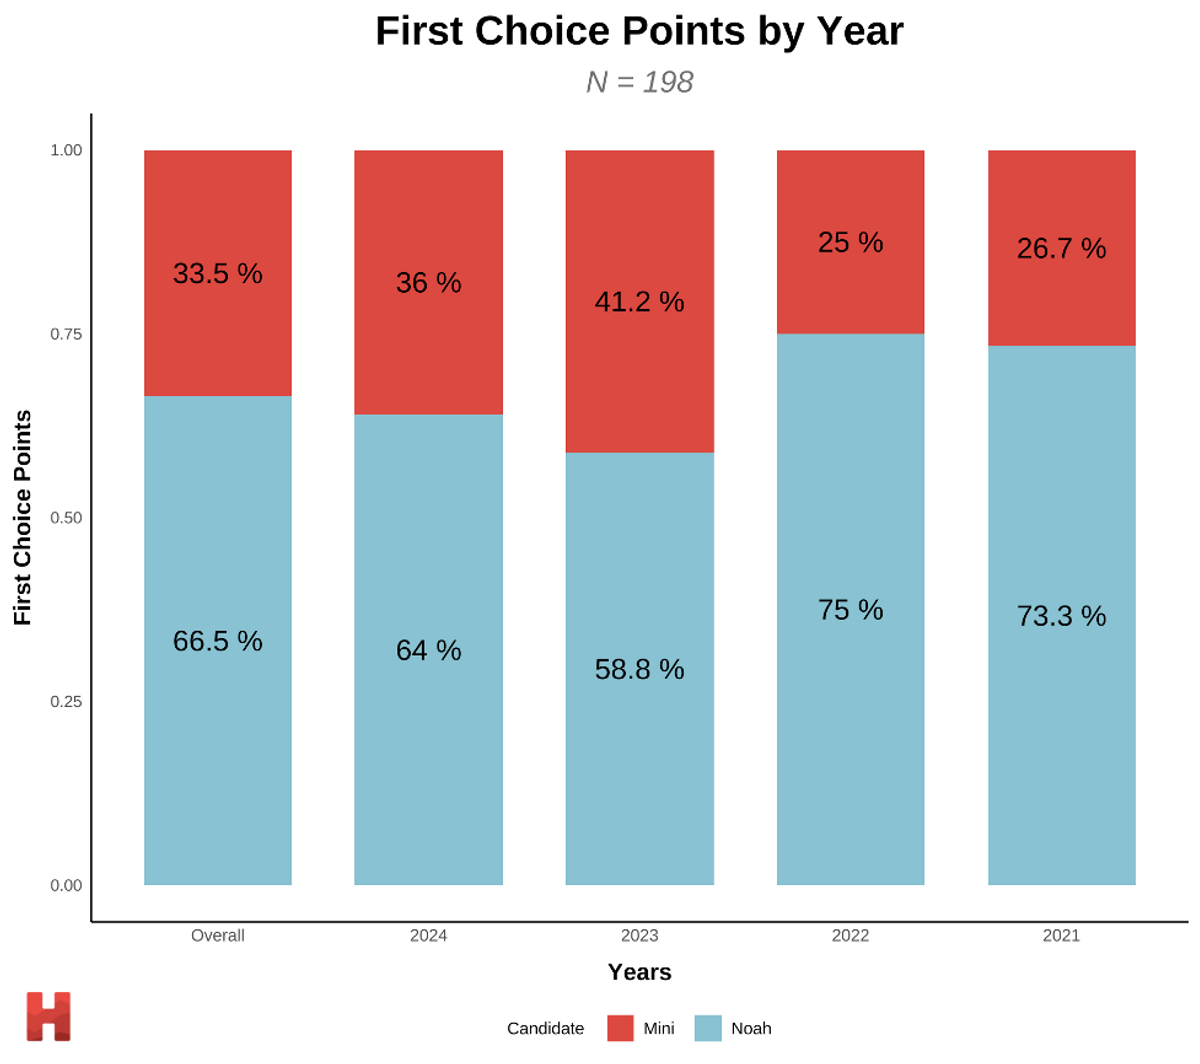
Notably, Mini & Nick have a stronger performance among sophomores, receiving 41.2 percent of their total first choice vote. This can be attributed to Nick’s standing as a sophomore, and their tagline as an inter-class ticket, but can also be potentially weighted up by an overrepresentation of sophomores (34 percent) in our poll. Likewise, seniors make up 15 percent, while freshmen and juniors each make up a quarter.
The upshot
Based on our polling data, we simulated a bootstrap election 1,000 times to see who wins most often. The sample of 100 outcomes below gives a good idea of the range of vote margins our forecast thinks is possible.
Like last year, we ran a robustness test on the data: what would Mini & Nick’s chances be if their proportion of supporters were higher in our sample? For example, if Mini & Nick received 60 percent more first choice votes, assuming Noah & Jenny’s share of votes stayed constant, we forecast a one-in-two odds of winning. If they received 80 percent more first choice votes in our sample, the odds become three-in-four. Not only are these turnout proportions unlikely, but they also check out against any variability — by way of sampling error — that can arise if eligible students i.e. enrollees do tend to vote differently.
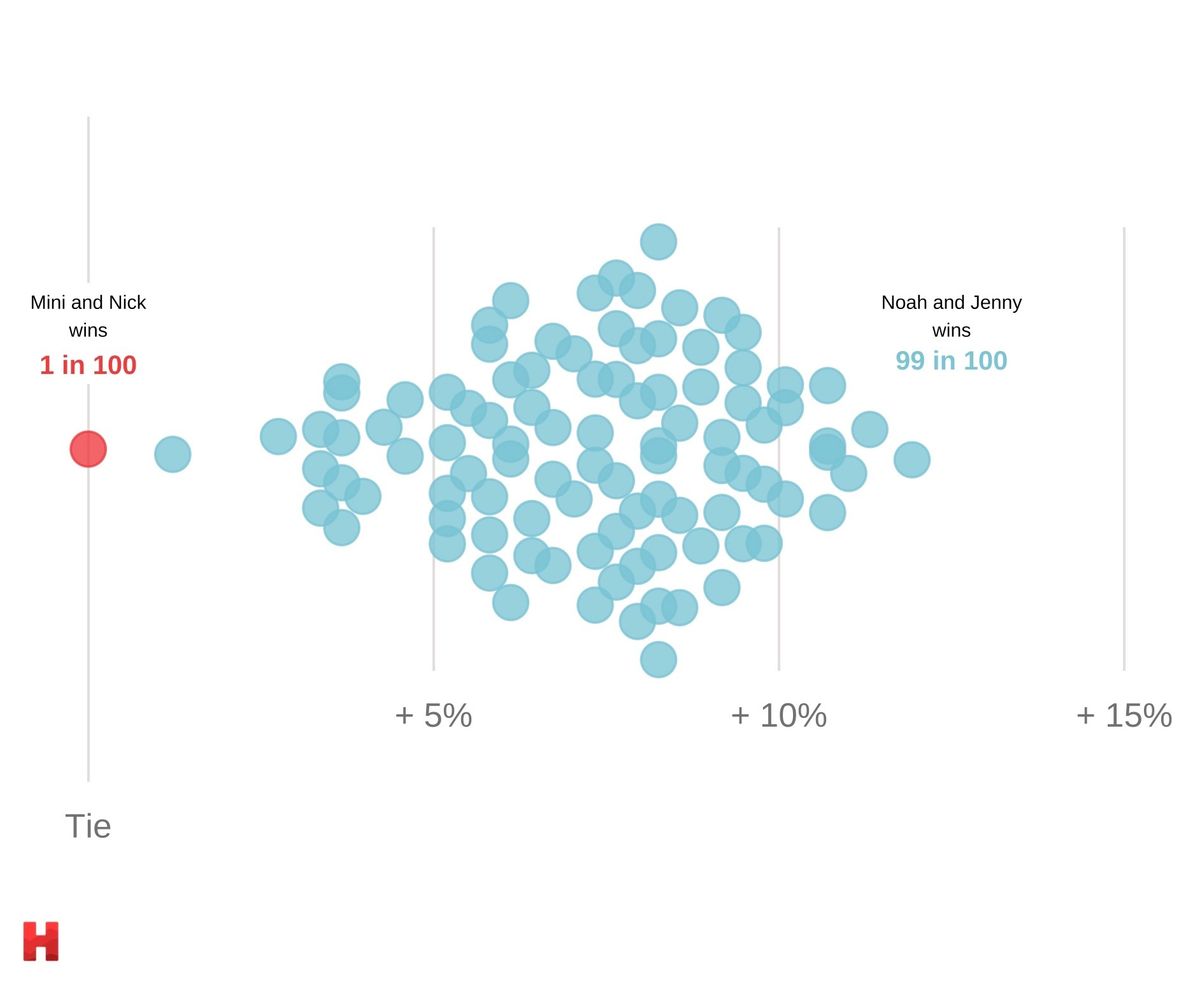
The big picture is clear in our poll: the race heavily favors Noah & Jenny. Unless Mini & Nick had really good turnout among their supporters, it’s unlikely they’ll surpass the 50% vote margin needed to clinch the presidency. For concreteness, even if we had undersampled Mini & Nick voters by 25% in our poll, they would have a 4% chance of winning.
Voting closed at noon today, and the results will be released tonight. Best of luck!
Thanks to Ashley Wong, Leo Saenger, and Melissa Kwan for helping with data collection and Alison Hu and Sahana Srinivasan for editing.