
Predicting the 2018 UC Presidential Election Winners
A data-driven election forecast by Manasi Maheshwari and Dasha Metropolitansky
Election season is in full swing at Harvard: on the heels of the U.S. midterms, students will vote for the next Undergraduate Council (UC) President and Vice President from November 12 to 15. We used past results, polling data, and social media trends to predict the next leaders of Harvard’s undergraduate student body.
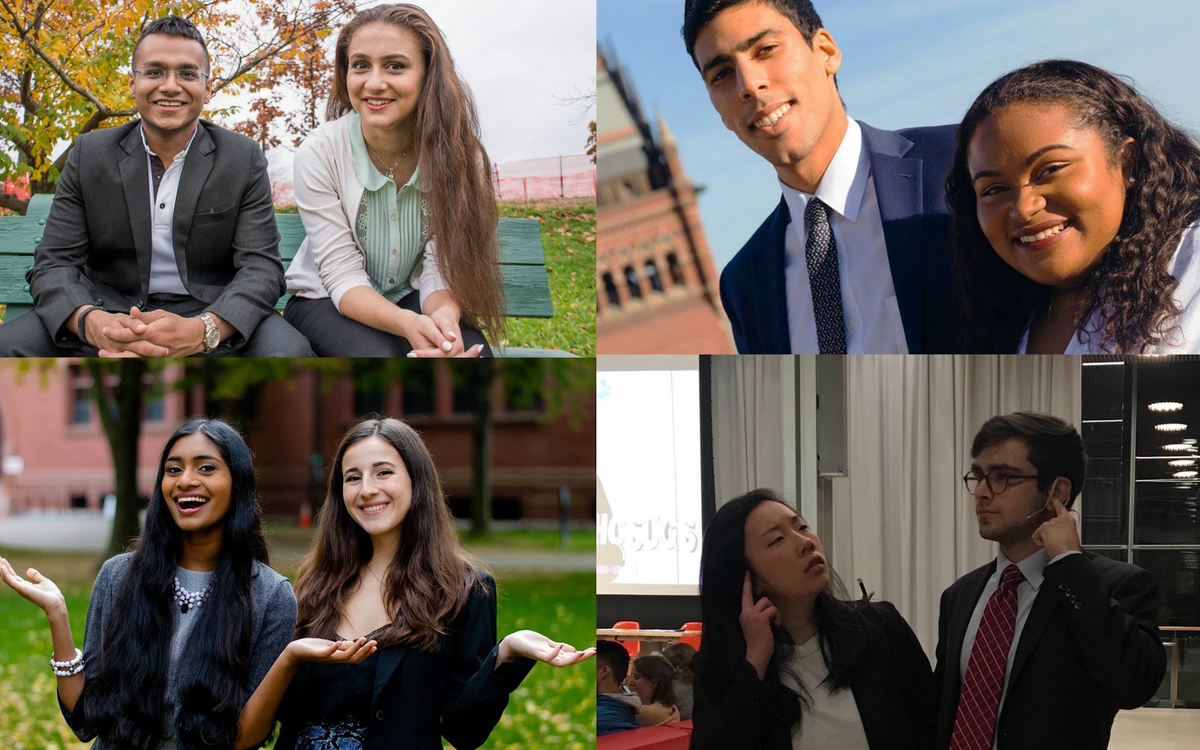
This year, four tickets are vying for the opportunity to lead Harvard College’s student body:
- Daniel Ragheb and Samyra Miller
- Sruthi Palaniappan and Julia Huesa
- Nadine Khoury and Arnav Agrawal
- John T. Ball and Sabrina Wu
A quick note: The Crimson has not included John and Sabrina as candidates in their recent coverage of the election, and they were not present at the UC Presidential debate. However, since they were approved as a ticket and their names appear on the ballot, we have included them in our prediction analysis.
In 2016 and 2017, the Harvard Open Data Project correctly predicted the results of the UC presidential election, and we hope to continue this streak. This year’s election will be slightly different from previous years because the UC has adopted a new voting system. Under the new system (Borda), voters rank each ticket; their first choice will receive 1 point, second 0.5 points, third 0.33 points, and fourth 0 points. Under the old system (Hare-Clark), voters also ranked the tickets, but if no ticket reached a predetermined threshold of first-place votes, then the bottom-ranked ticket was eliminated and its votes were transferred to remaining candidates. This process continued until a ticket met the threshold of first-place votes or all tickets but one had been eliminated.
With Borda, the ticket with the largest number of first-place rankings is not guaranteed to win if a competitor has a sufficiently large number of second and third place votes. In light of the fact that each voter’s preferences matter and can affect the outcome of this year’s election, our analysis of polling data will consider the total value of the tickets from all votes they receive, not just the number of first-choice votes as was done in previous years. In consultation with professional electoral analysts, HODP determined that Borda allows for strategic voting; to mitigate this risk, we published this article just before the end of the voting period to avoid influencing voter behavior.
Now let’s dig in…
Ticket Composition
Last year, the Harvard Open Data Project analyzed the common features of successful Presidential tickets since 2005. The two most significant factors seem to be past UC experience and the candidates’ houses. Where do the 2018 tickets stand on these points?
Experienced tickets do best.
- The trend: Tickets in which both the presidential and vice presidential candidate have UC experience constitute 55.3% of the total tickets since 2005, yet they’ve won 91.7% of the time.
- The tickets: Two of this year’s tickets are composed of two non-UC members (Daniel and Samyra, John and Sabrina). This is the largest number of UC-outsider tickets since 2007. The other two tickets are comprised of UC insiders.
Juniors tend to win.
- The trend: Tickets with juniors running for both president and vice president constitute 85% of total tickets since 2005, and they’ve won 92.3% of the time. Only 12.5% of tickets since 2005 have included a sophomore (always running as vice president) and of those, only 7% have won. However, since most candidates who run are juniors, the effect of this metric on results is unclear.
- The tickets: This year’s tickets mostly consist of two Juniors: Daniel and Samyra are the only Junior-Sophomore pair.
Quad representation is ideal.
- The trend: Since 2005, presidential candidates from the Quad have accounted for only 33% of total candidates but have won 53% of the time; 64% of presidential candidates have been from the River but have won 38% of the time. On the other hand, 11 of the last 12 vice presidential winners came from the River. It seems the ideal ticket has a presidential candidate from the Quad and a vice-presidential candidate from the River.
- The tickets: Two of this year’s tickets meet the Quad-River condition: Nadine and Arnav are from Cabot and Eliot, and Danny and Samyra live in Currier and Lowell. The other two tickets are River-River: John and Sabrina are from Leverett and Dunster, and Sruthi and Julia live in Winthrop and Lowell.
It’s important to note that these trends, while useful, are not guaranteed to hold true each year. For example, a joke ticket won the 2013 election, even though both candidates lacked UC experience and lived in River houses…
Polling
From November 7 to November 11, we conducted an online poll of Harvard undergraduates. We asked respondents to select their class (freshman, junior, sophomore, or senior) and rank the tickets from first to fourth. We received 264 responses. We believe that this sample is representative of the overall voting population because we assume that people who are more likely to respond to the poll are also more likely to vote in the election, which historically has low turnout.
Distribution of Voters’ Ranked Preferences
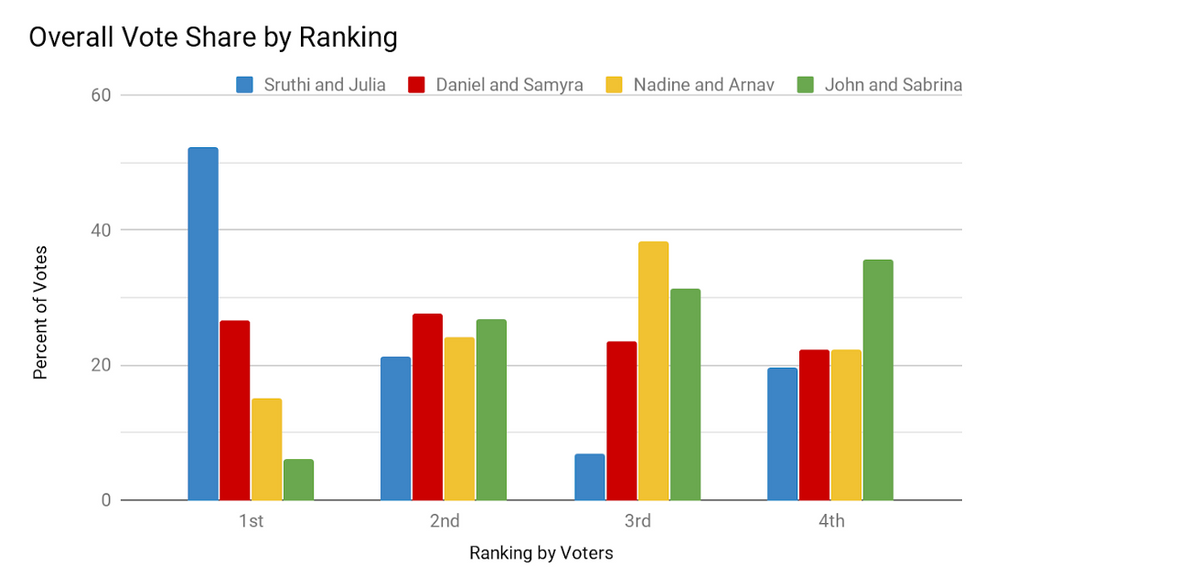 Sruthi and Julia won the majority of first-place votes, while Daniel and Samyra show a slim lead in second-place votes.
We found that:
- Sruthi and Julia received a clear majority (52%) of first-place votes, followed by Daniel and Samyra (27%), Nadine and Arnav (15%), and John and Sabrina (6%).
- Daniel and Samyra received the most (28%) second-place votes, but far from a majority. They were followed closely by John and Sabrina (27%), Sruthi and Julia (24%), and Nadine and Arnav (21%).
- Nadine and Arnav had the largest number of third-place votes (38%).
- John and Sabrina were the most common fourth-place vote (36%).
Total Ticket Value
We calculated the total ticket value by multiplying the number of first-place, second-place, third-place, and fourth-place votes for each ticket by 1, 0.5, 0.33, and 0 respectively and adding these values. Here’s what we found:
- Sruthi and Julia earned 171.94 points.
- Daniel and Samyra earned 126.96 points.
- Nadine and Arnav earned 105.33 points.
- John and Sabrina earned 78.89 points.
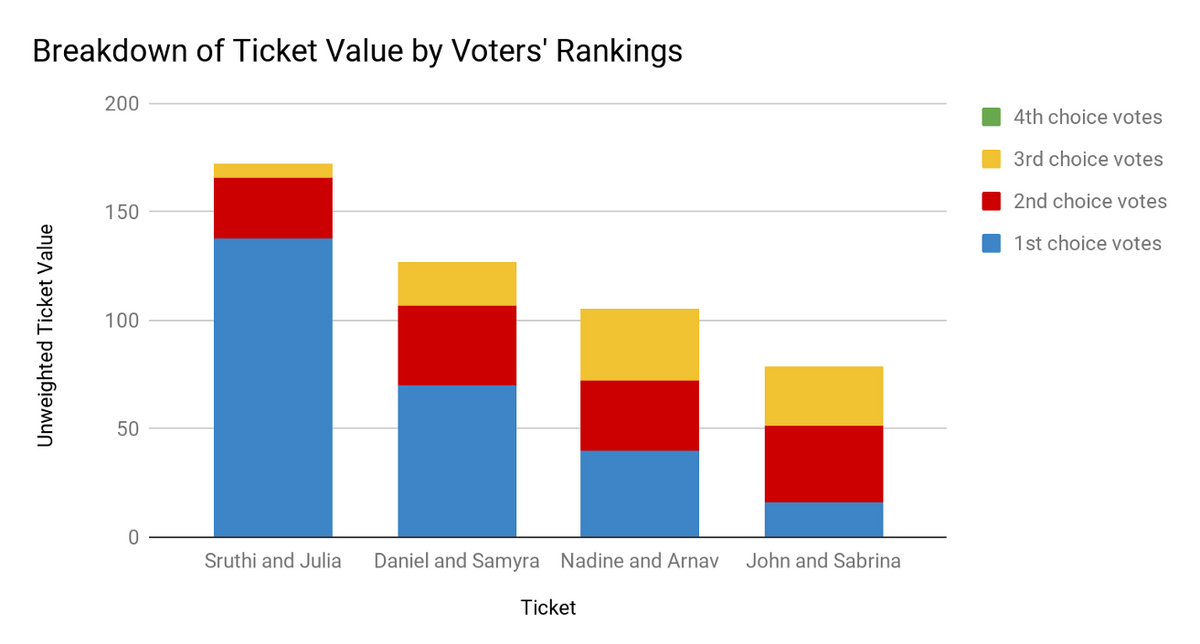 The top tickets (Sruthi and Julia, Daniel and Samyra) received most of their value from first-place votes.
When we broke down the tickets’ total value by the points won from each ranking, we discovered two interesting results. Firstly, total value was directly related to the proportion of total value contributed by first-place votes. Secondly, total value was inversely related to the proportion of total value contributed by non first-place votes. In other words, the ticket with the greatest point total (Sruthi and Julia) earned the most value from first-place votes and the least value from the combination of second, third, and fourth-place votes, while the reverse was true for the ticket with the lowest point total (John and Sabrina). The key implication is that when no ticket claims a significant lead in second-place and third-place votes, the number of first-place votes will likely determine who wins.
Class-Weighted Ticket Value
Next, we adjusted the total ticket value calculation by assigning weights to class. Each year, freshmen make up most of the voters in the election, so we weighed their votes more heavily than those of upperclassmen. The specific weights correspond to each class’ voter turnout percentage in last year’s fall UC elections. Here are our results for the total points of each ticket weighted by class:
- Sruthi and Julia earned 43.11 points.
- Daniel and Samyra earned 34.51 points.
- Nadine and Arnav earned 26.12 points.
- John and Sabrina earned 21.05 points.
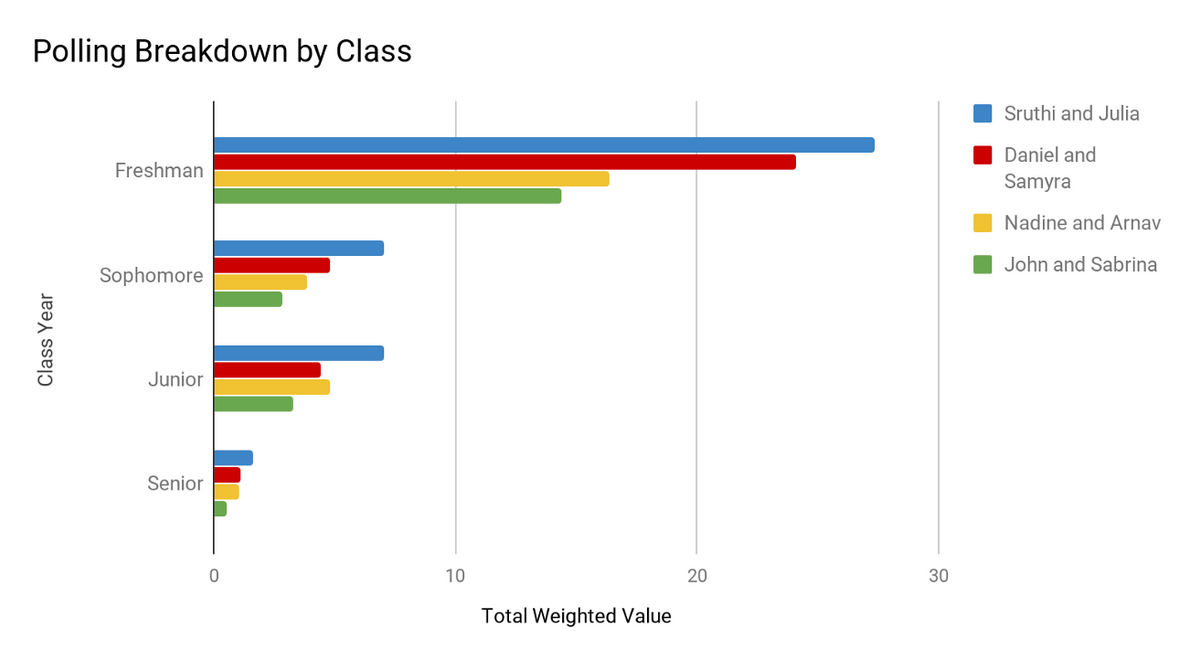 Sruthi and Julia dominate in points among all classes, and the largest proportion of their total value comes from freshmen.
Even when we account for the importance of winning freshman votes, the same ticket rankings observed in the unweighted total ticket value calculations hold. However, we noticed that the gap between the winning and runner-up tickets narrows, and, similarly, the difference between the third and fourth-place tickets is reduced. This is likely explained by the fact that the top ticket (Sruthi and Julia) received only a slightly larger point value from freshmen than the second-place ticket (Daniel and Samyra), and the same is true for the comparison between the third (Nadine and Arnav) and fourth-place (John and Sabrina) tickets.
Social Media
In past elections, social media presence and name recognition have been important indicators of candidates’ success. We tracked each ticket’s Facebook presence from Tuesday November 6 to Monday November 12.
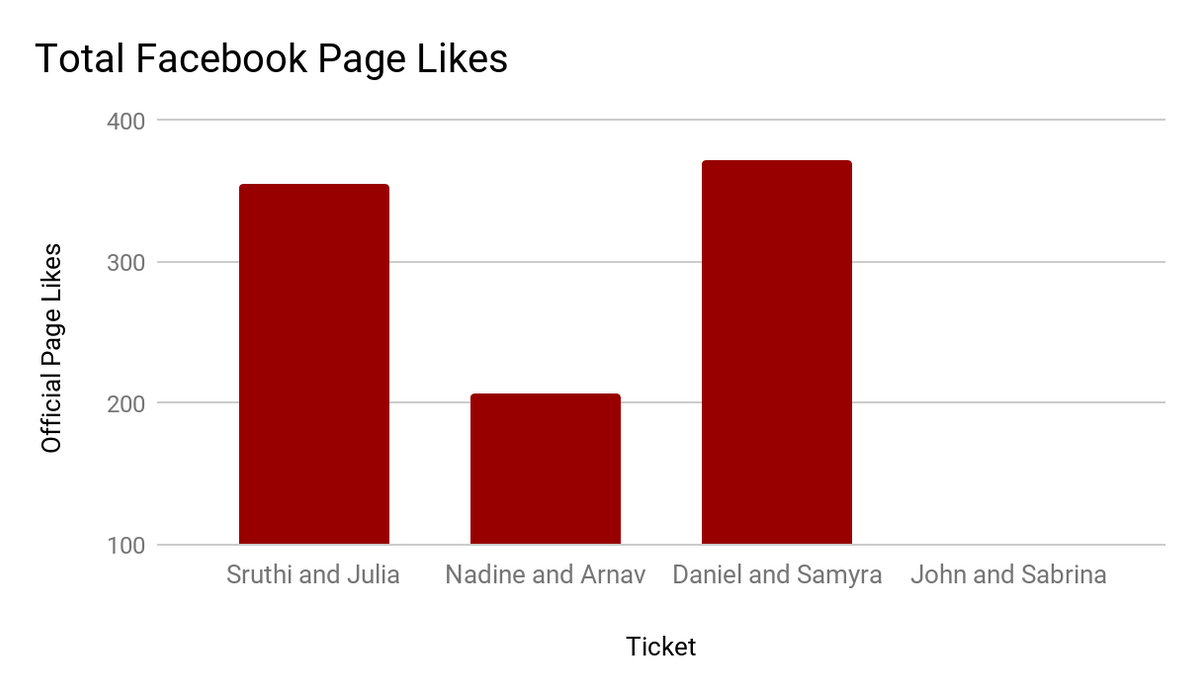
Campaign Facebook Pages
Daniel and Samyra’s Facebook page had the greatest number of likes, followed closely by Sruthi and Julia. Nadine and Arnav’s page had substantially fewer likes than the top two tickets. John and Sabrina did not create a Facebook page, so their social media presence was notably lacking compared to the other candidates.
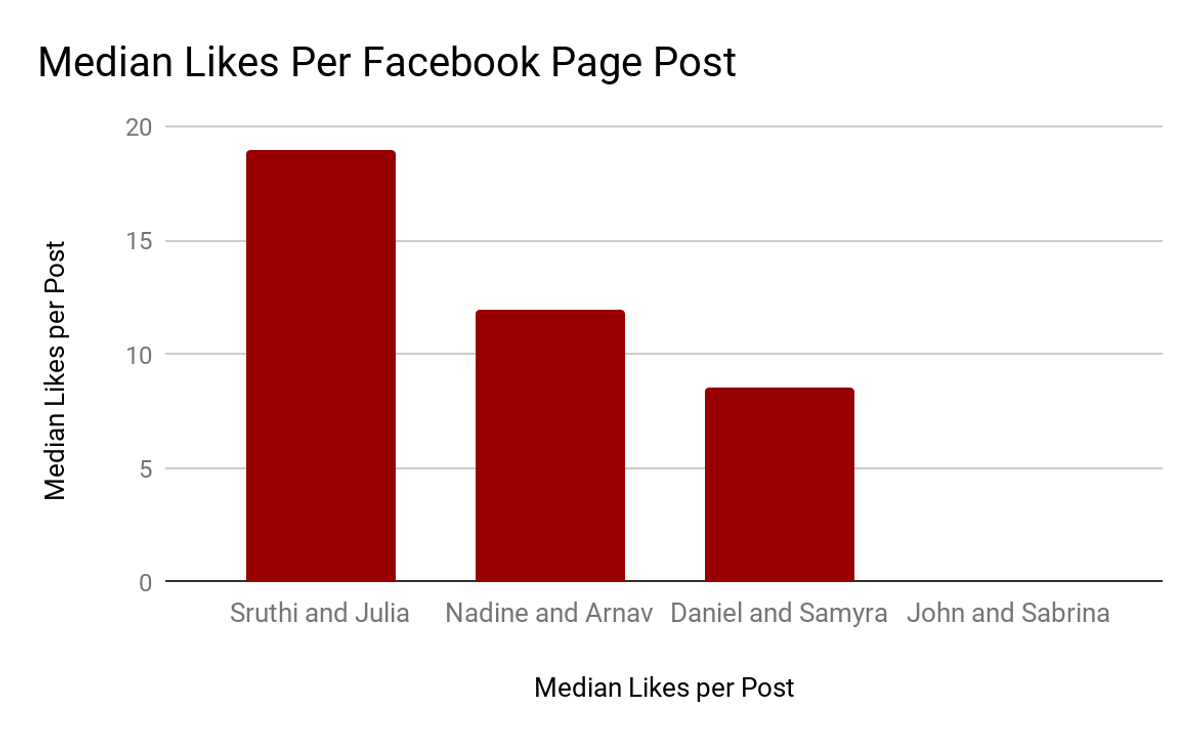
 Daniel and Samyra’s Facebook page had the most likes, edging out Sruthi and Julia.
Next, we looked at the median number of likes per post on the tickets’ official Facebook pages. We chose to analyze the median rather than the mean because likes per post varied significantly, and the median is more resistant to outliers. Although Daniel and Samyra had the greatest number of people who liked their page, Sruthi and Julia had the highest median likes per post. They were followed by Nadine and Arnav, then Daniel and Samyra. Since John and Sabrina did not create a Facebook page, they were not represented in this metric.
 Sruthi and Julia had the greatest median number of likes per post on their Facebook page.
Supporting Facebook Posts
We also accounted for social media support by tracking Facebook posts made by Harvard College students in support of a ticket, both while collecting signatures to qualify for the election and after the tickets officially declared their candidacy. We defined supporting posts as messages of endorsement as well as profile pictures and cover photos with a ticket’s filter.
We calculated the median number of likes per supporting post for each ticket and found that Sruthi and Julia came out on top, followed by Nadine and Arnav, then Daniel and Samyra, and finally John and Sabrina.
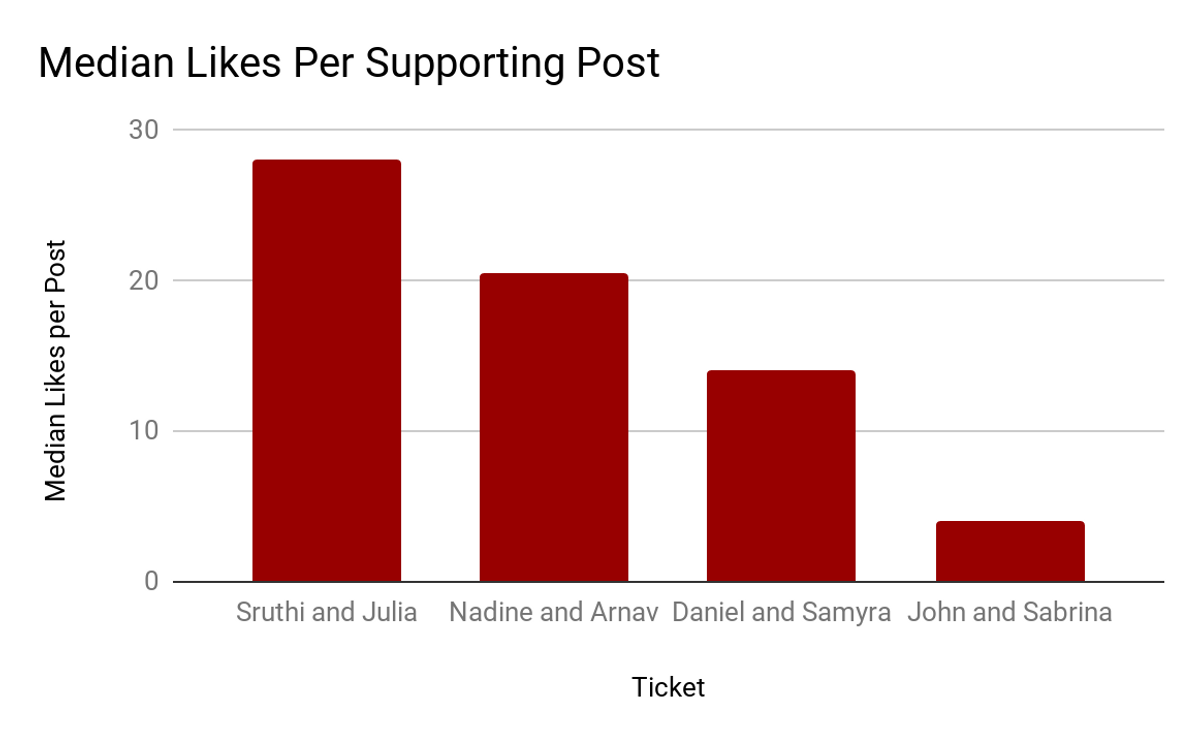 Sruthi and Julia had the most likes per supporting post, while John and Sabrina had the least.
Limitations
- We focused our social media data collection exclusively on Facebook because it offers access to the most public data, and it has consistently been the primary platform used by candidates for their campaigns. However, this means we did not capture data from other platforms like Instagram, Snapchat, or Twitter, which could have altered our findings. For example, Sruthi and Julia’s Instagram page has 429 followers, while Nadine and Arnav’s page has 18.
- It’s possible that groups of friends would like each other’s posts, so our model might have counted likes by the same people multiple times. This is why we chose to report the median likes per post rather than total likes, as well as the number of unique supporters instead of the total number of likes across all posts for each ticket.
- Although the presence of likes on a post generally implies support for a ticket, they do not necessarily indicate endorsement or intent to vote. For example, we might simply like our friend’s profile picture with a ticket’s filter even if we have no intention to vote for that ticket.
- We didn’t consider other metrics that could indicate the level of the candidates’ name recognition, such as involvement in campus groups and initiatives, endorsements by UC members and other student organizations, and private meetings and events held by the candidates to engage with the student body. For example, Sruthi and Julia have been endorsed by campus organizations like The Crimson and the Harvard Democrats. Daniel and Samyra held an event to help students with CS50, a class taken by many freshmen. John and Sabrina are well-known for their involvement in the Harvard College Stand-Up Comic Society and The Lampoon. Nadine and Arnav engaged directly with Quad students by promising to improve shuttle schedules and create nap spaces in the Yard.
Conclusion
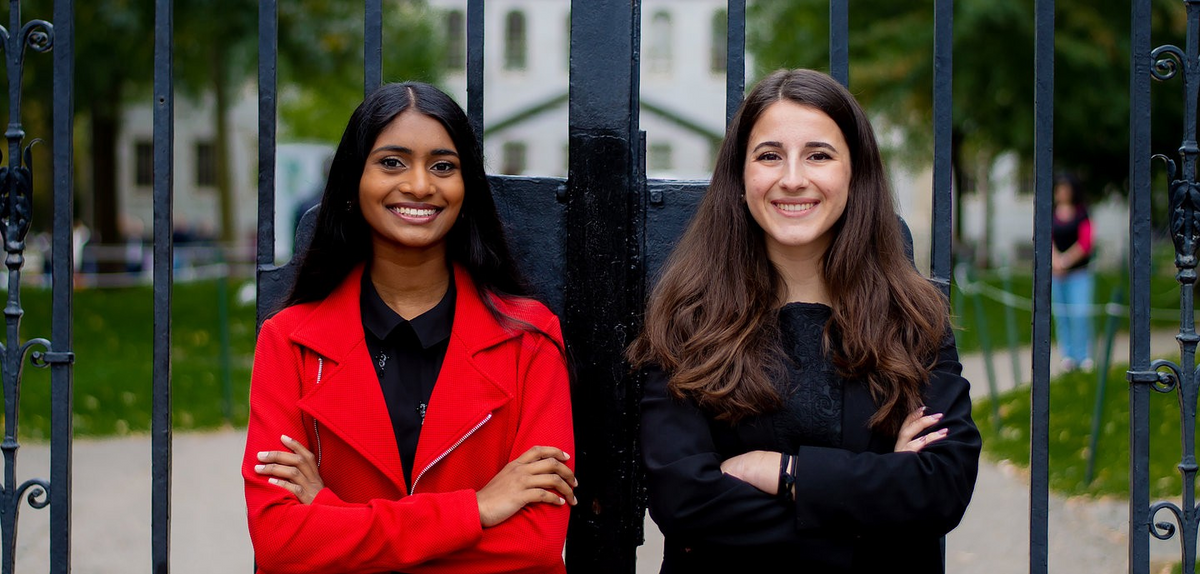 Sruthi Palaniappan and Julia Huesa, the next UC President and Vice-President according to our data, pictured in a campaign photo.
Based on our analysis of polling data and social media presence, we predict that Sruthi Palaniappan and Julia Huesa will be elected the next President and Vice-President of the Harvard Undergraduate Council.
We expect to see Daniel Ragheb and Samyra Miller in second place because of their strong poll results and large follower base. We predict that Nadine Khoury and Arnav Agrawal will rank third; their advantageous ticket composition and social media presence will help them place above John T. Ball and Sabrina Wu.
Best of luck to the candidates, and don’t forget to vote!