
What affects UC voter turnout at Harvard?
Why is voter turnout so low in elections for the UC? In recent years, how have electoral reforms, such as the recent shift in voting system, to the UC legislative process influenced number of candidates or voter turnout?
Introduction
Every fall, Harvard undergraduates cast votes to elect their Undergraduate Council (UC) representatives. Student voter turnout, however, has never been one of the student body’s strengths. While voter turnout varies between houses, some houses observed voter turnout as low as 12% in 2019. Why is voter turnout so low in elections for the UC? In recent years, how have electoral reforms, such as the recent shift in voting system, to the UC legislative process influenced number of candidates or voter turnout?
Our project focuses largely on understanding the influence of the number of candidates running for the UC and of the 2018 shift of the UC voting system — from the Hare-Clark electoral system to the Borda Count method — on voter turnout. This is particularly relevant in making sure that the UC election process properly and effectively represents undergraduate student voter preferences and, consequently, their voices and concerns.
Data
Utilizing data provided by the Harvard Crimson Housing Market from 2017 to 2019, the Harvard Facebook, and the Undergraduate Council, we compiled the total number of eligible voters in each house and the number of ballots cast in each UC election since 2017. Extracting this data allowed us to analyze the voter turnout of each dorm for each election, as well as change in voter turnout across the years. The data we collected excluded Dudley House’s data, as there was not consistent data to create meaningful results. In our graphs, each house is represented by one data point per year, displaying the number of candidates running for UC and the voter turnout as a percentage of eligible voters.
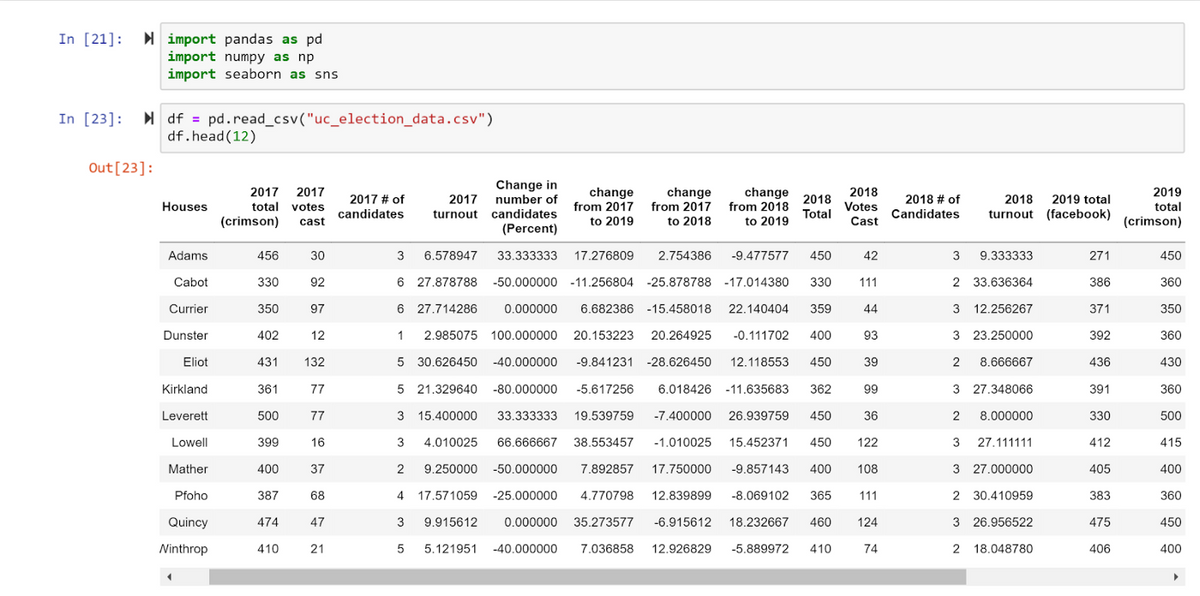
This chart highlights the voter turnout in each upperclassman house during the time period from 2017 to 2019. This also highlights the period (2017–2019) during which the voting system was changed from the Hare-Clark to Borda. Voter turnout is low in many houses, but there is variation across years.
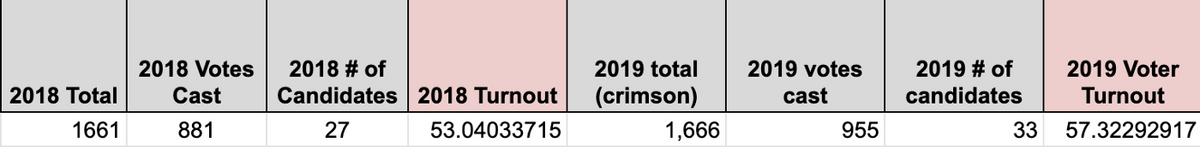
Since we did not have data for the size of each first-year yard, we analyzed the data of first year voter turnout from the standpoint of the entire class. This data may not give us as much insight into the voting patterns of first years in regards to the correlation between number of candidates to voter turnout in their constituencies, however it can still provide valuable information when compared to the turnout of upperclassmen.
The data for first-years is as follows:
Data Analysis
In 2018, the UC voting system shifted from Hare-Clark to Borda Count. The shift, legislated by the UC Election Commission, occurred after recommendations from the Harvard chapter of Voters Choose. Before the shift, The Crimson reported mixed reviews and predictions from UC representations about the influence of the new voting system. Some “doubted a new voting method would encourage students to vote, arguing that the process by which votes are counted is less important than the election software itself,” while others advocated for the easily comprehensible nature of the new voting system.
We observed that the change was insignificant using Seaborn, a statistical data visualization in Python. This observation indicates that the institutional change in voting systems did not influence student turnout. Initially, this result did not appear intuitive to us. We had hypothesized that students would vote more, due to the perception that the Borda Count system seemed more representative of student voter preferences than the Hare-Clark system.
The Borda Count system asks voters to rank candidates, granting each candidate a number of points corresponding to the number of candidates ranked below them. For example, if there are three candidates running, a 1st choice vote would be worth three points, a 2nd choice vote two points, and a 3rd choice vote one point. The Hare-Clark system, on the other hand, eliminates the bottom candidate if the number of candidates who receive first-place votes does not meet a certain threshold. Therefore, Borda Count appears more representative since it accounts every preference, whereas Hare-Clark does not account lower preferences until later in the counting process. With that line of reasoning, we hypothesized that Borda Count may more accurately reflect the opinions of the student body. Our results, however, negated our hypothesis.
We proceeded to analyze other factors that may have influenced voter turnout. We reasoned that student engagement in Undergraduate Council activities — voting during annual elections — is dependent on the representation of other students, namely their peers. We also considered that low voter turnout could reflect a lack of enthusiasm due to a low number of candidates, especially when the number of candidates is less than or equal to the number of available UC positions.
We hypothesized that students tend to more actively involve themselves in the UC and other student legislative bodies when they are directly impacted by certain referendums or hold a greater stake in the election. These forms of involvement may include: general impression of current UC delegates, personal acquaintanceship or association with a candidate, or perception of larger firsthand impact by the policies proposed by a diverse range of candidates. All of these factors likely to increase voter turnout could be the result of a larger candidate field.
2017 # of Candidates in House vs. Voter Turnout in House
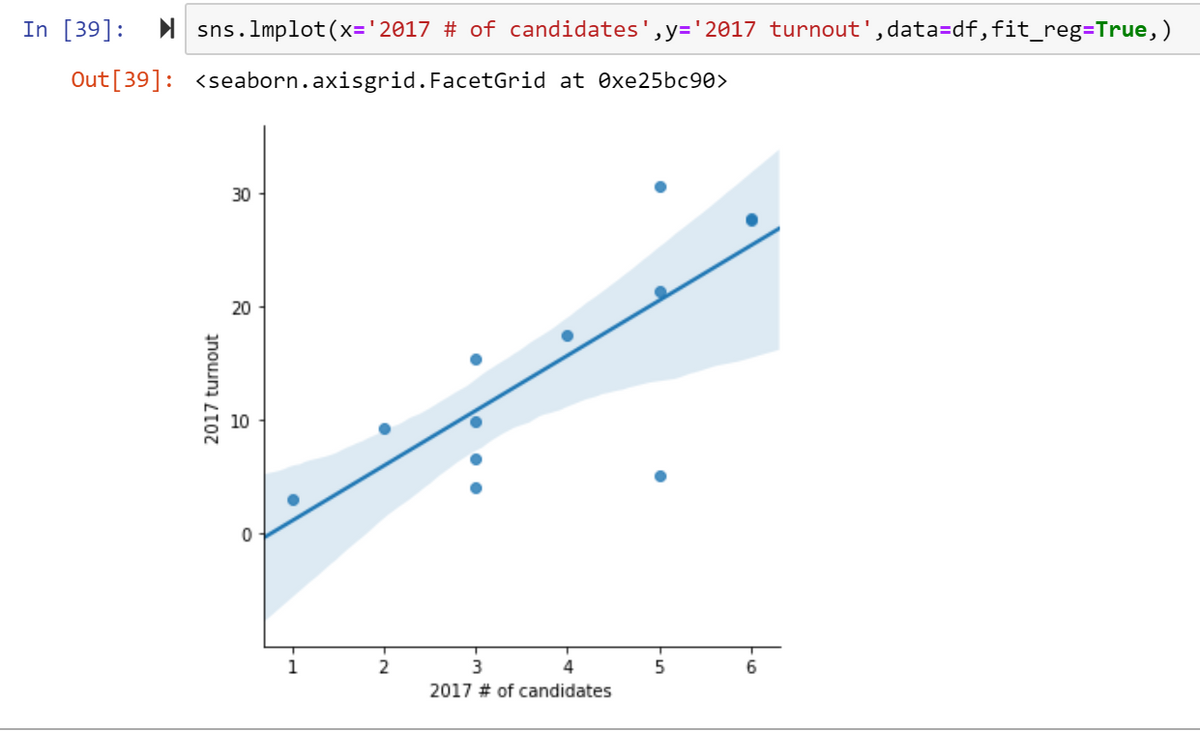
In 2017, there was a correlation between the number of candidates running for seats on the Undergraduate Council in each house and voter turnout in that house.
2018 # of Candidates in House vs. Voter Turnout in House
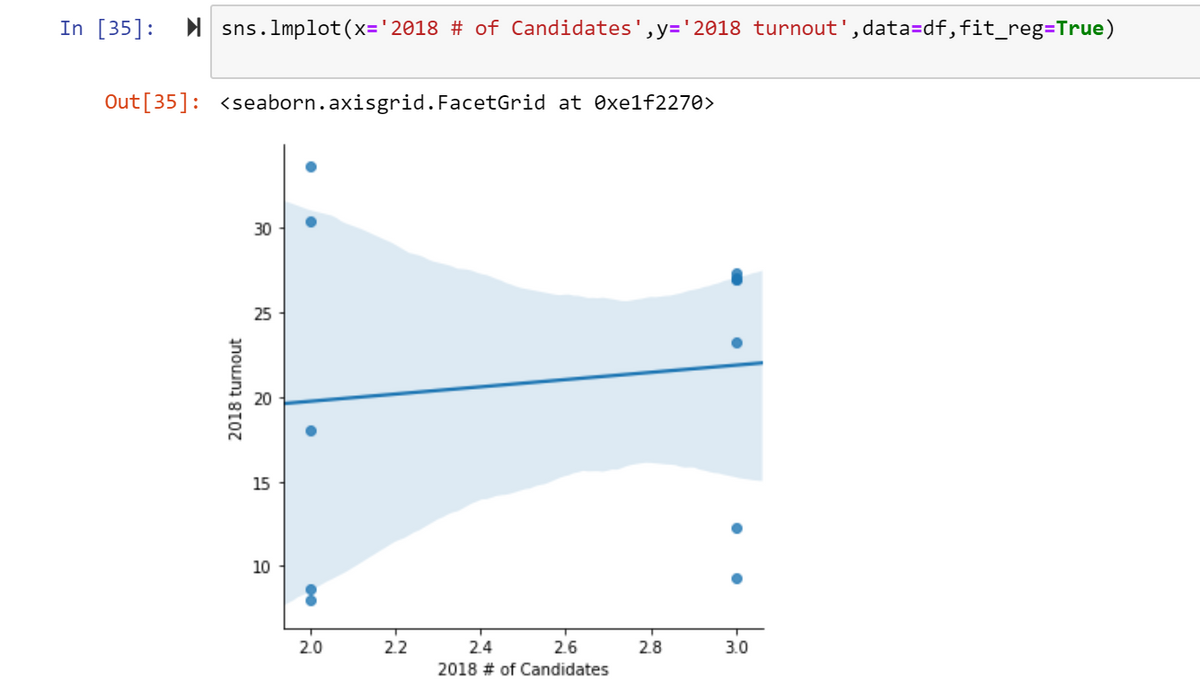
In 2018, there was a weaker, yet still present, correlation between the number of candidates running for seats on the Undergraduate Council and the voter turnout.
2019 # of Candidates in House vs. Voter Turnout in House
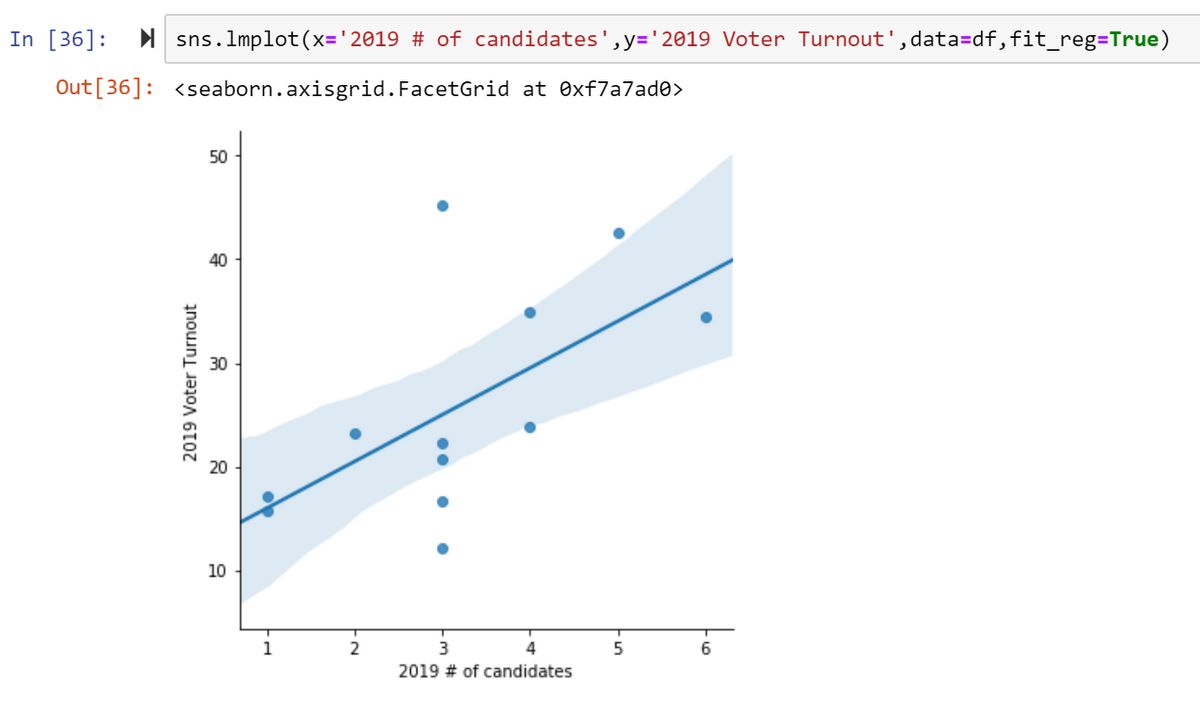
In 2019, similar to 2017 there was another positive correlation between the number of candidates running for seats on the Undergraduate Council and voter turnout.
Upon analyzing this data, many questions still remain. We weren’t able to concretely identify the causes of low UC election voter turnout or recommend possible reforms to increase student involvement with the UC. We hypothesize, however, that students may perceive their individual votes as not impactful relative to implementation of legislation with actual significance. Further projects should focus on identifying why students do not vote and how students perceive the role of the Undergraduate Council. These analyses and conclusions will help establish reforms in order to create an elected body which is truly representative of student interests and accomplishes meaningful projects, thus improving Harvard life for all undergraduate students. Additionally, we were not able to account for certain differences between individual voters. For example, different voters would prioritize different projects and different traits in UC candidates.
Among first years, in both 2018 and 2019, there was a turnout of greater than 50%. While we do not have enough data about the yards to correlate voter turnout to number of candidates in each constituency, we can use the general proportion of candidates to the population to draw a similar comparison. We can see that the number of candidates made up 1.63% of the general population in 2018 and 1.98% of the general population in 2019. In 2019 the voter turnout was 4.28% higher than the voter turnout in 2018, and this increase may be due to this higher ratio of candidates to population since this higher ratio would imply that it is more likely for voters to know the candidates personally.
Voter Turnout for First-Years Versus Upperclassmen
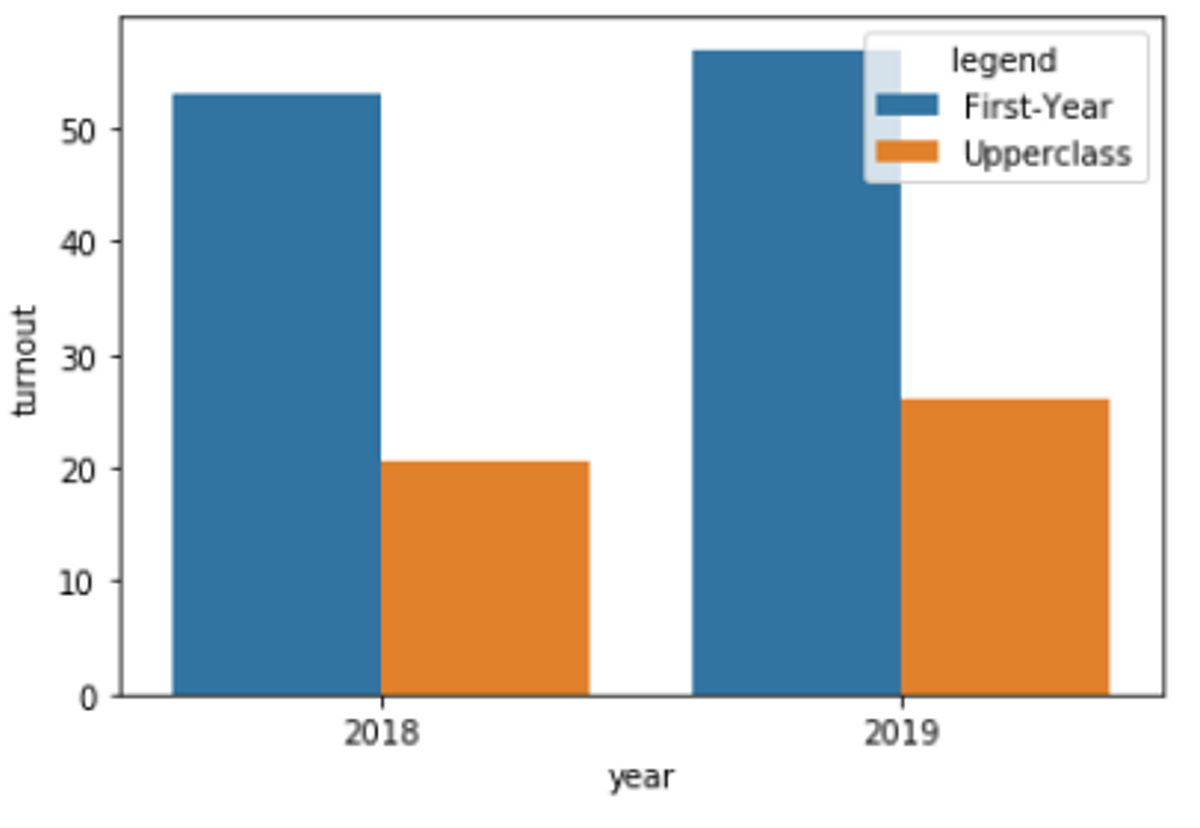
If we treat the upperclassmen data like we treated the first year data (as a whole block), we can also observe some interesting phenomena. We hypothesized that first-year voter turnout would be higher, as first-years may be motivated by the freshness of electing UC representatives — this election cycle would mark their first opportunity to vote for college representatives. Furthermore, it can also be hypothesized that this novelty and eagerness to participate would also lead to a greater proportion of first years running to be representatives.
Meanwhile, the percentage of the population that ran as an upperclassman in 2018 was .63% and the percentage of the population that ran as an upperclassman in 2019 was .79%. Interestingly, the ratio of turnout to percent of population that ran was about the same across the board for both first years and upperclassmen. It is unclear why this is but further supports the idea that as more people run, more people vote.
In conclusion, we were able to identify that as more candidates participate, voter turnout for that particular house also increases likely due to the fact that more people will have personal stakes in the candidates. It is notable that voter turnout from upperclassmen houses was far smaller than turnout from first-years in both 2018 and 2019. Perhaps studying the difference between first-year and upperclassman attitudes toward the Undergraduate Council could provide valuable insight into how we might try to improve turn out for the rest of the student body.