
COVID-19 tops student voting issues, and Biden heavily favored
With less than an hour until the first results of the election come in, HODP is providing a snapshot of how Harvard students feel about the candidates, issues, and the state of the race.
With less than an hour until the first results of the election come in, the Harvard Open Data Project wants to give a snapshot of what Harvard students think of the state of the race. We collected student opinion on the presidential debates via our survey group over September and October, and we’re ready to share the data: at a glance, about four-fifths of Harvard undergraduates are likely to vote for Joe Biden, with the COVID-19 pandemic weighing heavily on the minds of most students.
The winners
The topline on the first debate is clear: Harvard students were not impressed by Donald Trump’s performance, with just 5.7 percent of 252 respondents percent of respondents declaring the president the winner. By contrast, a majority of respondents believed Joe Biden won the debate — in line with the national verdict on Biden’s performance.
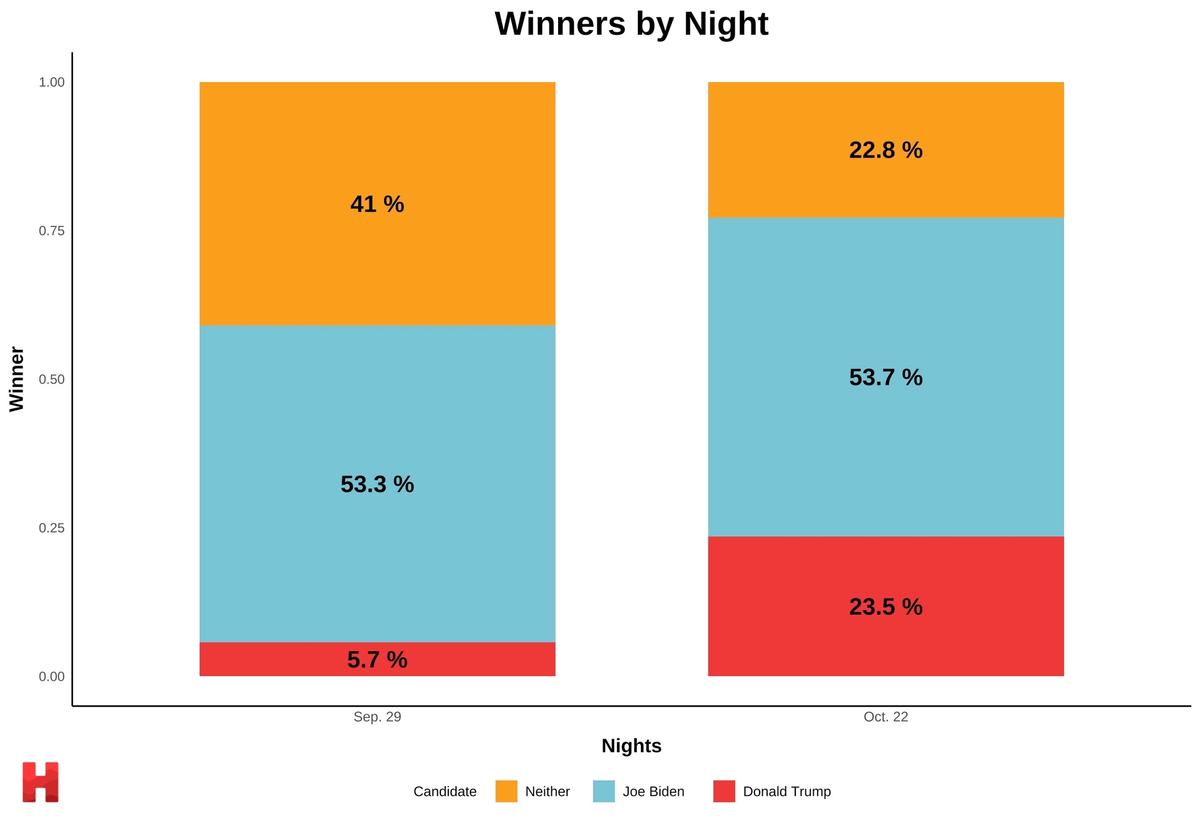
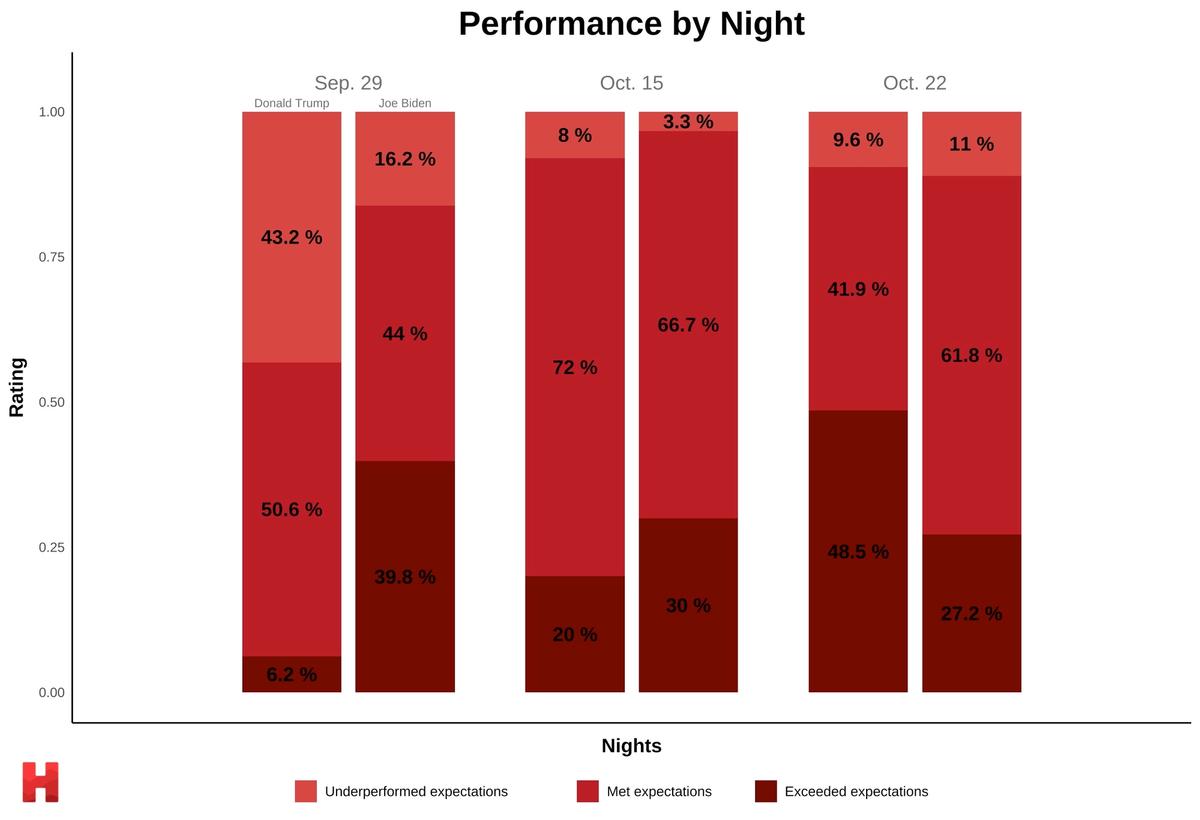
Respondents were more impressed with both Biden and Trump’s performance in the Oct. 22 debate though: 89 percent thought Biden met or exceeded expectations in the final debate, a 5.2 percentage point jump from the first debate. Trump gained the most ground, with 23.5 percent believing he won.
Did the debates change the minds of viewers?
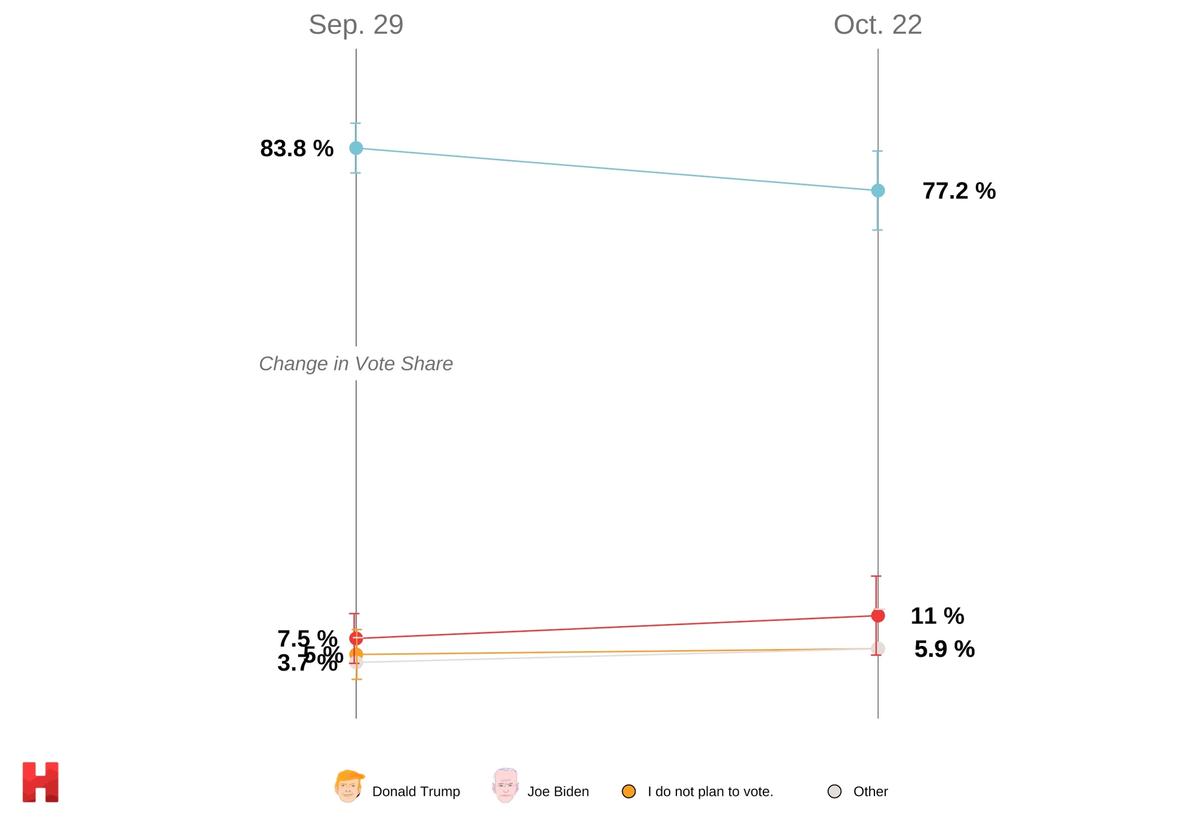
Late October’s debate marked the last time Donald Trump and Joe Biden faced off before election day, but did it shake up the race in the minds of Harvard students? Most respondents went into the Oct. 22 debate with a clear candidate preference, and that didn’t really change — in line with national polling. Post-debate national polls conducted by FiveThirtyEight find little to no movement after the debate, with public opinion on the candidates and their platforms remaining unchanged.
The final debate also didn’t have much of an effect on who respondents thought would win the presidency. The share of Harvard students who thought Biden has a better chance of winning decreased from 77.6 to 75 percent from the Sep. 29 poll. Likewise, the share of respondents who say they’ll vote for Biden decreased by only 6.6 percentage points. Both these changes still remain well within our polls’ margins of error.
 The Sep. 29 poll has 252 respondents and a margin of error of +/- 3.8 percentage points. The Oct. 22 poll has 137 respondents and a margin of error of +/- 6.1 percentage points.
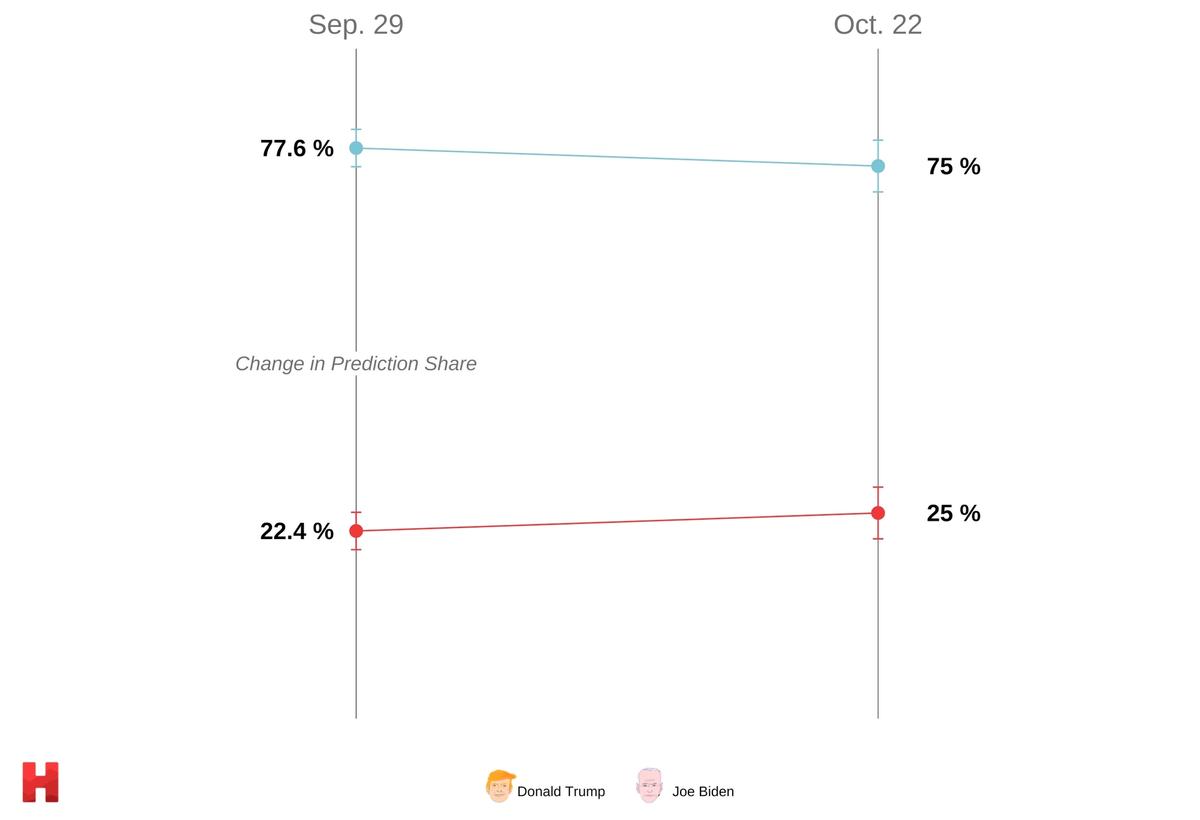 The Sep. 29 poll has 252 respondents and a margin of error of +/- 2.7 percentage points. The Oct. 22 poll has 137 respondents and a margin of error of +/- 3.7 percentage points.
 National polls, as well as historical trends, shed light on the current “tightening” of the race: national averages have shifted to be more in line with state polls, which if used properly, can actually give a better projection of the national popular vote. Moreover, a fair number of incumbent presidents historically perform better in the second debate after struggling in the initial bout, and Trump is really no different. Though from the initial data, he had a low bar to clear.
Most respondents are definitely still planning to vote, although they’re not necessarily excited.
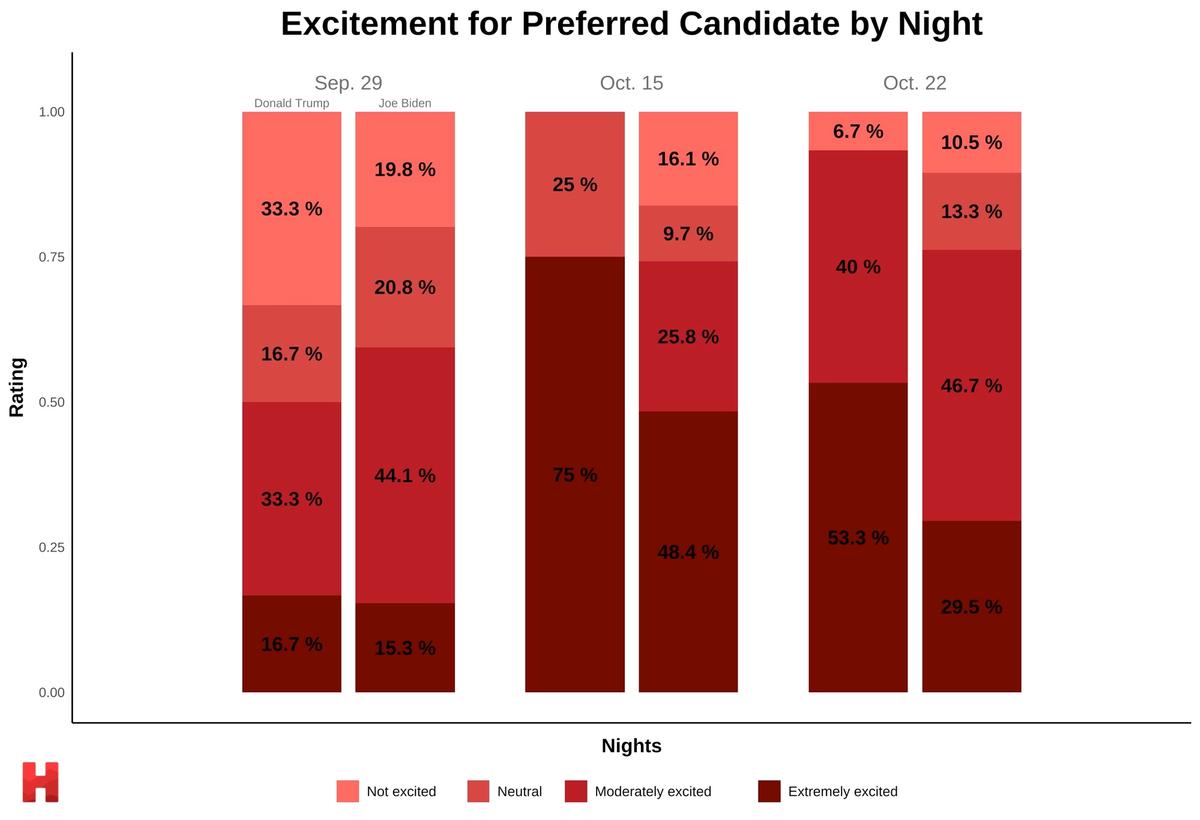
We asked how excited respondents were to vote for their choice candidate, with 93.3 percent and 76.2 percent saying they were at least ‘moderately excited’ to vote for Trump and Biden, respectively. This again should give little pause given the demographics of Harvard’s student body. Our previous year’s article describes Harvard undergraduates as “young, overwhelmingly liberal, and highly educated” — a demographic that is less likely to support Biden versus his more radical counterparts: Bernie Sanders and Elizabeth Warren.
How Harvard students will cast their ballots
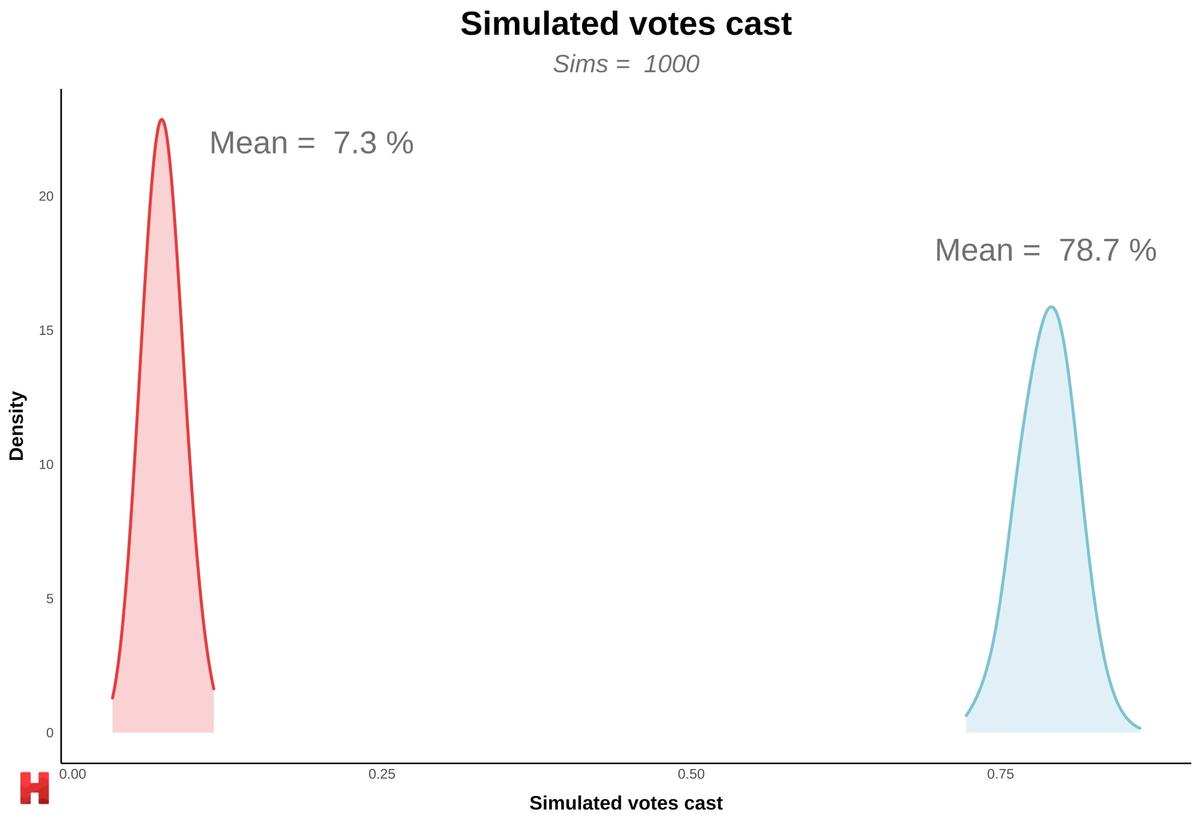
To get an estimate of how Harvard students will split the vote, we conducted a bootstrap simulation of votes cast based on our current polling data. Our simulation forecasts that roughly 78 percent of eligible undergraduates will stick to the Biden camp, while around 7 percent will vote for Trump. Respondents were also given the option of a third-party candidate or ‘other.’ Additionally, they could indicate that they will not vote. Roughly 6 percent of students are estimated to not vote for any candidate, but this is most likely subject to some nonresponse bias — students who respond to our polls are also the ones most likely to vote.
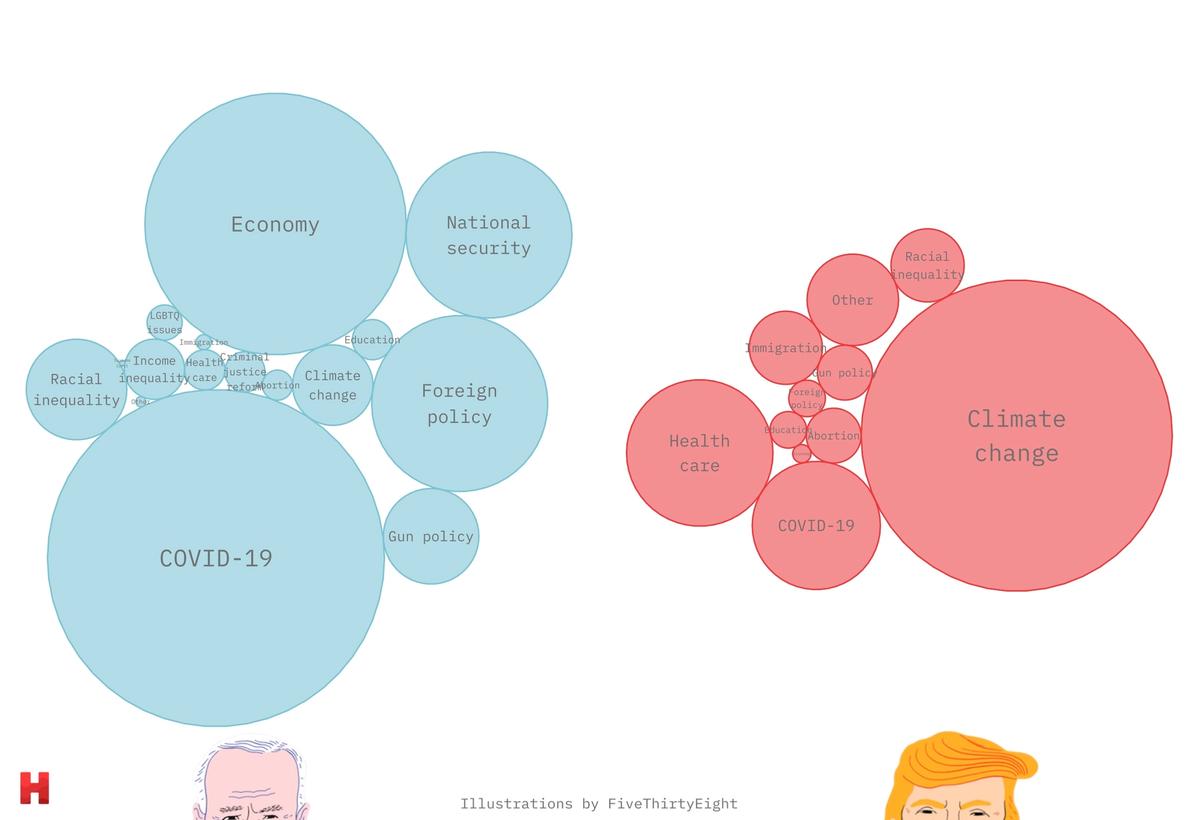
The issues that divide Harvard students
There is no shortage of issues that divide Harvard students — Spring plans, HUPD, David Kane. Asking respondents to choose the three issues they thought were most important to this election, we find that the COVID-19 pandemic dominates students’ minds, comprising respondent lists 54 percent of the time. This comes at a time where a 2:1 majority of voters nationally are dissatisfied with Trump’s handling of the pandemic. Climate change comes at a close second, appearing 51 percent of the time. At least a quarter of respondents all say racial inequality, health care, and the economy are important policy areas — issues that have come to the foreground since last year.
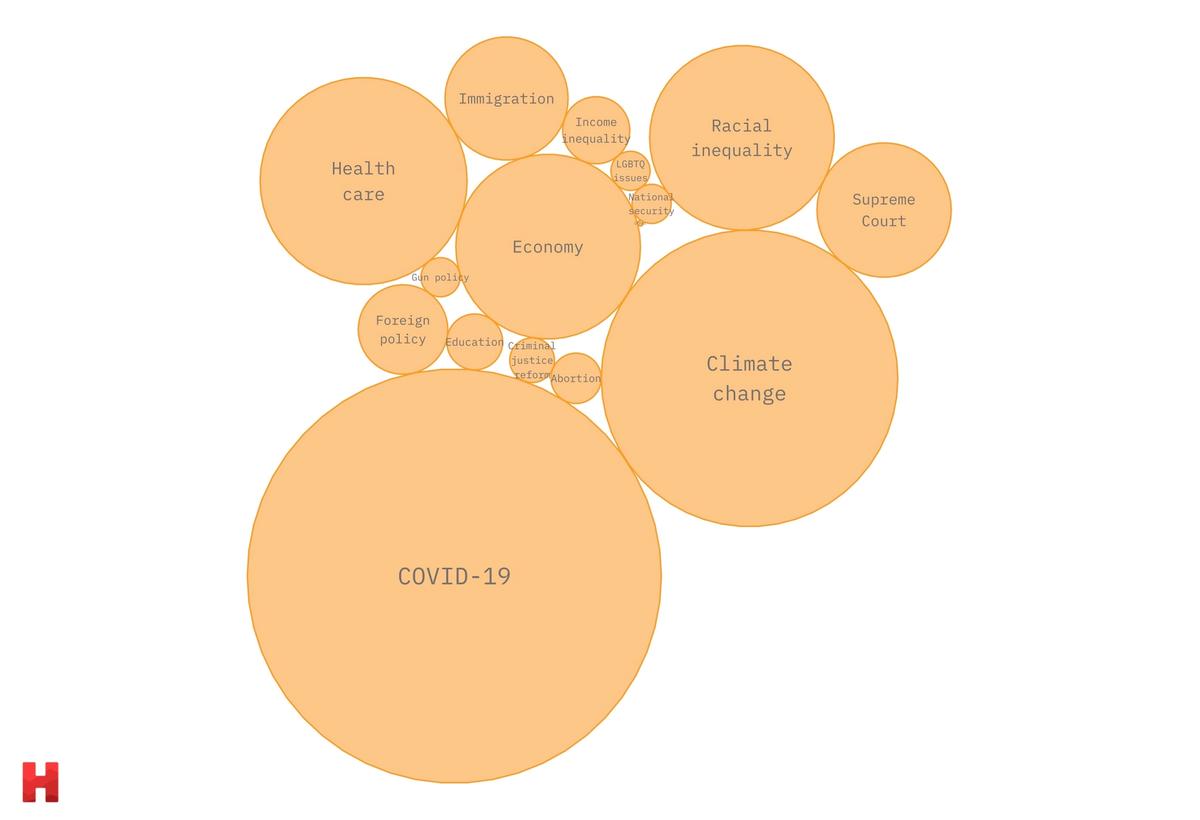
We also looked at respondents’ top issues by party: overwhelmingly more Democrats ranked COVID-19 as a top priority compared to Republicans — in line with a national majority of Democrats supporting a national mandate for a coronavirus vaccine. Notably, a majority of Republican respondents ranked climate change as a top issue, although this more reflects the Harvard student body’s general consensus on the issue rather than a rallying cry in the Republican camp. This is also subject to increased variability after “weighting up” the Republican sample (n = 35).
Our polls
The data presented here comes from three polls sent out to HODP’s survey group. The first poll was sent out after the Sep. 29 debate and accepted responses until Oct. 6, with 252 total respondents. The second poll was sent out after the Oct. 15 town halls, accepting responses until Oct. 22, with 108 respondents. Lastly, the third poll was sent out after the Oct. 22 debate, accepting responses until Oct. 29, with 137 respondents. In total, we received 333 unique responses.
It’s important to note that our respondents are not a random sample of Harvard undergraduates — joining the survey group is first voluntary. The breakdown of our respondents roughly reflect that of Harvard’s admitted students, though white and Asian students (57% and 28% of our respondents, respectively) are overrepresented in our group, while Black students are underrepresented by 6 percentage points. The respondent pool is also subject to some amount of attrition from each wave of polling, which we do weight for. Finally, the data is potentially subject to some non-response bias: our pool of respondents may be systematically different in terms of voting behavior from students who chose not to respond.
Final thoughts
In the aggregate, our polls are snapshots, not predictions, of how Harvard students feel about the election and how they’re casting their ballots. The results of any pre-election survey will depend heavily on when it was fielded; in our case, three snapshots taken immediately after heavily publicized, televised debates. Candidates will often experience a polling “bump” after a notable event, like a debate, that fades after a short period of time. For example, in 2016, Hillary Clinton received a roughly six point bump after the first debate that almost completely faded.
But the largest challenge is determining whether students who say they’ll vote actually end up doing so. Historically, polls tend to be highly accurate when measuring public attitudes, but less predictive of public behaviors, especially in regards to young voters. And with huge uncertainty surrounding national issues like the pandemic, as well as campus-specific concerns like Harvard’s reopening plans, on students’ minds, it’s fair to say we need to accept the uncertainty of the moment and follow the data.
Thanks to Sam Thau for co-heading this project and Sahana Srinivasan for editing. If you’d like to join the Harvard Open Data Project survey group, visit hodp.org/surveys.