
Scraping Plates and Scraping Data: Exploring Dining Hall Habits via Mange
Does your dhall always seem packed? Or deserted? Check out the busiest and chillest mealtimes by house.
Introduction
There are few locations as closely tied to the daily rhythms of Harvard undergraduate life as the house dining halls. At their best, dhall meals serve as much-needed breaks from classes and activities, during which we decompress and engage with our house communities. Some dining hall meals are less pleasant, featuring long lines, less-than-appetizing food options, and excruciating wait times for grill orders. Given the importance of the dining halls in undergraduate life and the variability of diner experiences, it would be of great practical utility to understand patterns of traffic at Harvard’s dining halls. However, HUDS does not publish any official data on dining hall traffic. Does this mean all hope of understanding the humble Harvard dhall-goer is lost?
Fortunately, the answer is “No”. Most Harvard undergraduates are familiar with Mange. Originally developed by Harvard undergraduate Enrique Dominguez-Meneses in 2016, Mange is a mobile app that allows students to view daily menus and place grill orders at Harvard dining halls. Crucially, Mange also provides an estimate of the wait time for grill orders at each undergraduate house.
It is likely that grill waits are not entirely representative of general dining hall traffic, since students who frequent the grills may have unique dining habits, and weekly variation in the HUDS menu may influence the volume of grill orders. We explore these considerations in more detail at the end of the article. However, we believe that the correlation between grill waits and dining traffic should still be strong enough to discern interesting qualitative patterns.
Basic Analyses of Traffic Patterns
To anyone who has been to Harvard dining hall, it is clear that dining hall traffic fluctuates significantly throughout each day and week. One of the most basic and informative pieces of information that can be derived from our dataset is a time course of traffic over the duration of typical lunch or dinner. Below we show the average grill demand over the course of lunch each day (data from Winthrop and Quincy are excluded due to anomalies which will be discussed later):
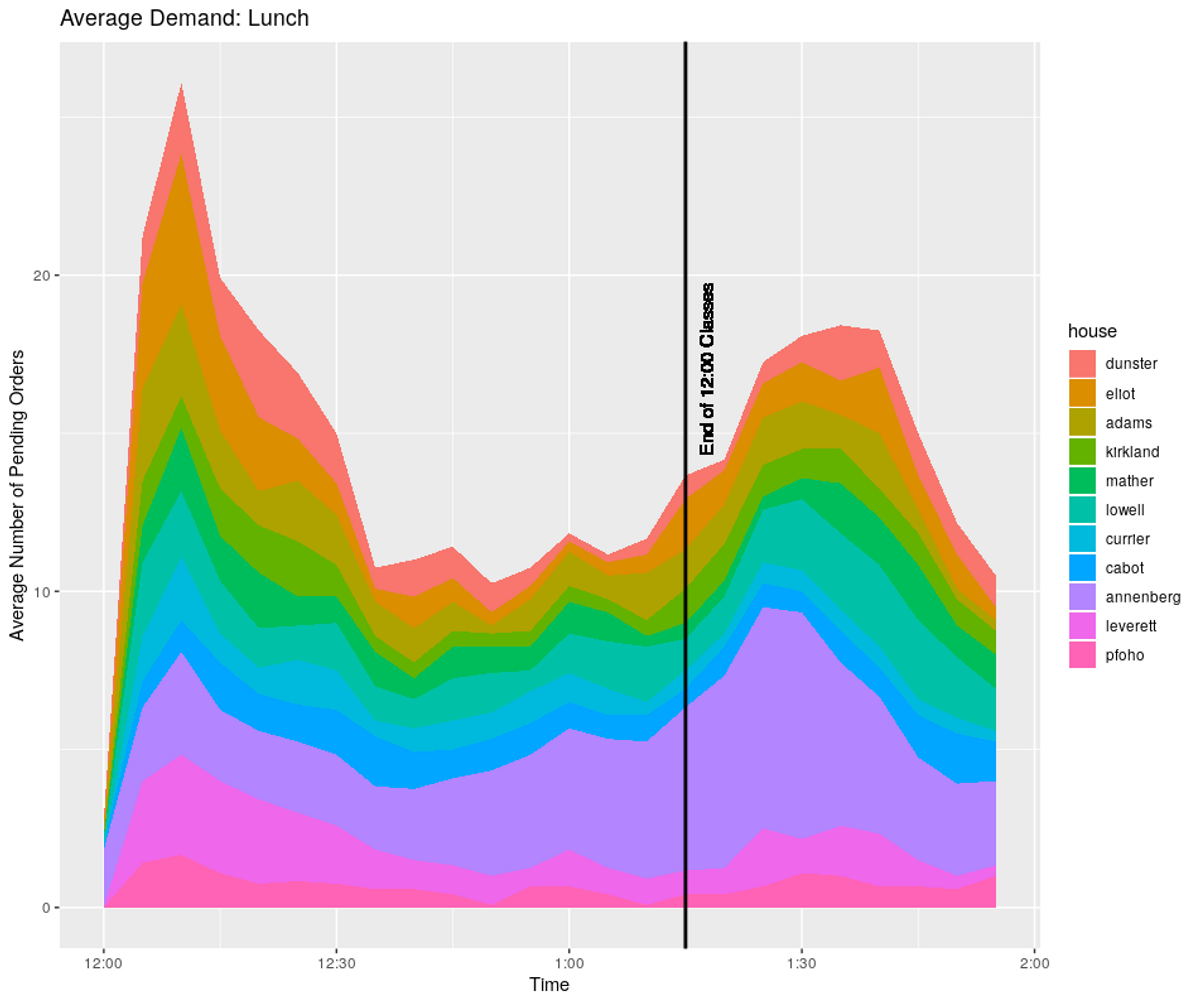
This second rush likely represents lunch-goers who are returning from their 12:00 classes, which end at 1:15. Therefore, if you want to avoid a crowded dining hall at lunch, your best bet is probably to go between 12:30 PM and 1:15 PM, which corresponds to a lull between these two peaks in demand.
To test the hypothesis that the biphasic lunch demand is a consequence of class schedules, we can decompose lunch demand over days of the week:
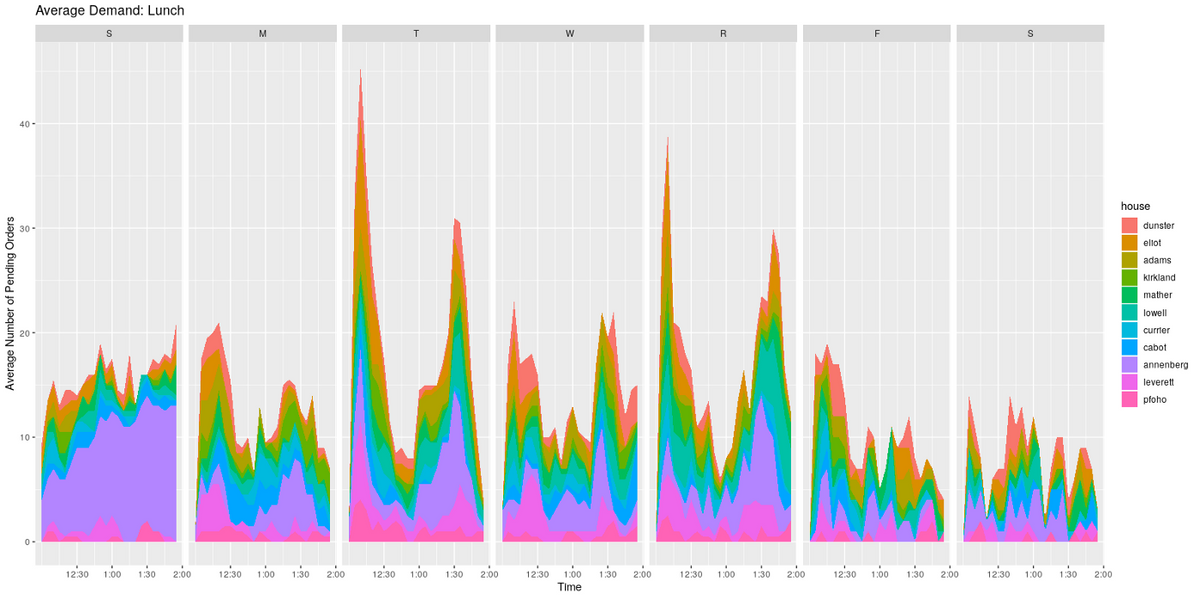
In this breakdown, the biphasic demand for lunch is present on Monday, Tuesday, Wednesday, and Thursday, which are the days most undergraduate classes are held. In contrast, the pattern on Friday, Saturday, and Sunday is less clear. This supports the hypothesis that the lunch demand pattern is caused by the presence of 12:00 classes during much of lunch time. The day-by-day breakdown of lunch demand also reveals spikes in traffic on Tuesday and Thursday. This pattern could be related to class schedules, but is not as readily explained as the bimodal distribution of lunch demand. Annenberg also makes up a colossal proportion of Sunday traffic, indicating first-years are drawn Sunday brunch more than upperclassmen, for whom the allure of Veritaffles may have faded.
Turning our attention to dinner, we observe a much different time course:
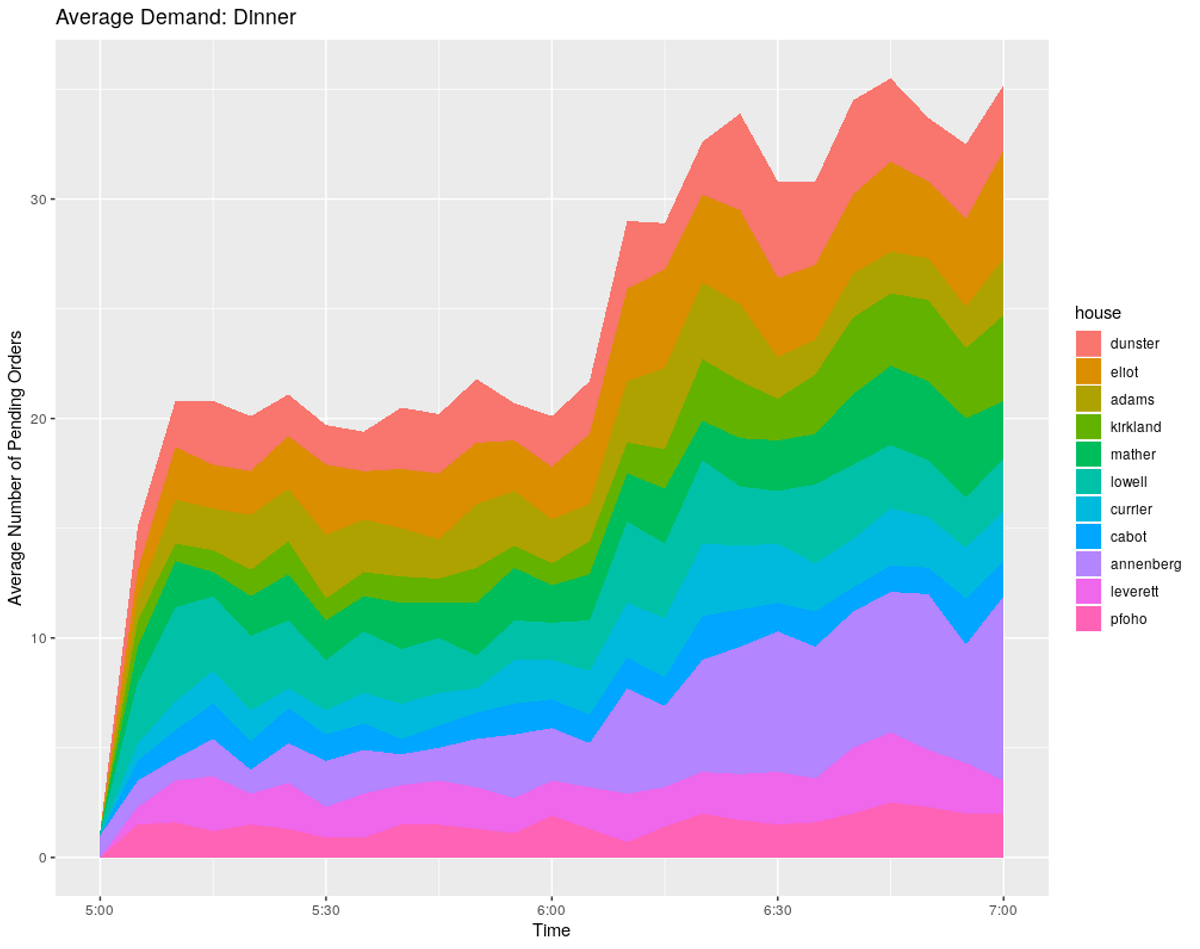
The general trend for dinner demand also shows distinct phases: There is a relatively flat, moderate level of traffic from the opening of the grill at 5:00 PM until approximately 6:15 PM. This first plateau is followed by a rapid increase in traffic, resulting in elevated traffic levels from approximately 6:20 PM until the end of dinner.
Decomposing dinner demand by days of the week shows a similar pattern across all days:
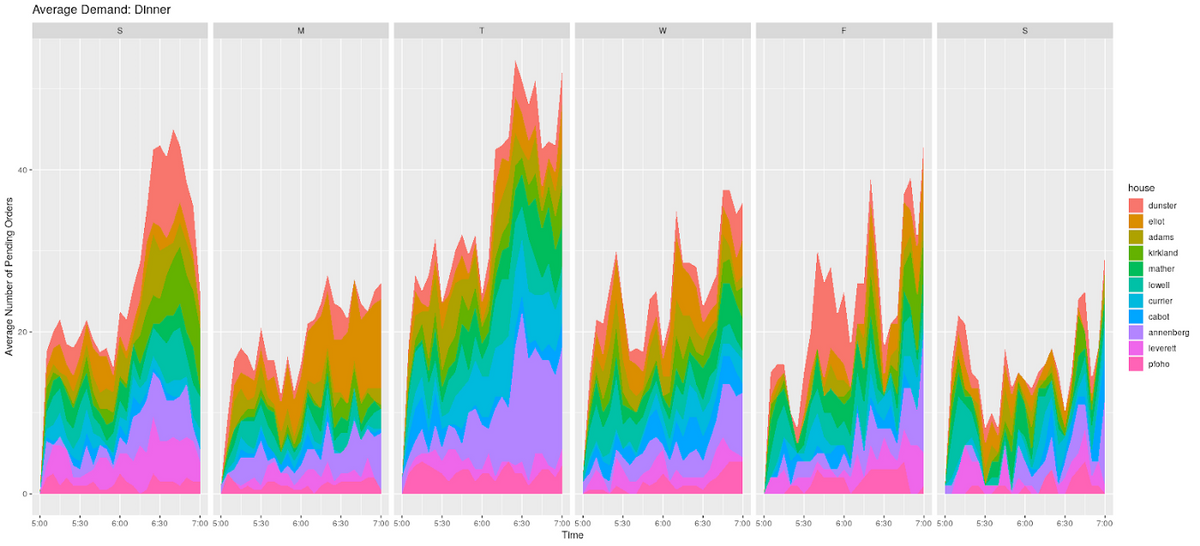
Notice that Thursday does not appear in this plot, since the grills do not take dinner orders on Thursday during Bistro Bowl nights. All days show the general trend of an initial plateau in traffic followed by a prolonged elevation in traffic, with the possible exception of Saturday.
Analysis of Traffic by House
Two houses, Winthrop and Quincy, have been absent from our plots thus far. We noticed some anomalies in the data collected from these houses, and decided to exclude them from our analyses. The exact nature of these anomalies is discussed later in this article. While the exclusion of these houses does not affect the general trends observed in the previous section, it does mean that house-specific analyses of dining are unavailable for these houses. If you live in Winthrop or Quincy and wanted to see how your house stacks up, we are sorry.
The most basic house-specific analysis we can conduct is to look at total volume of orders by house:
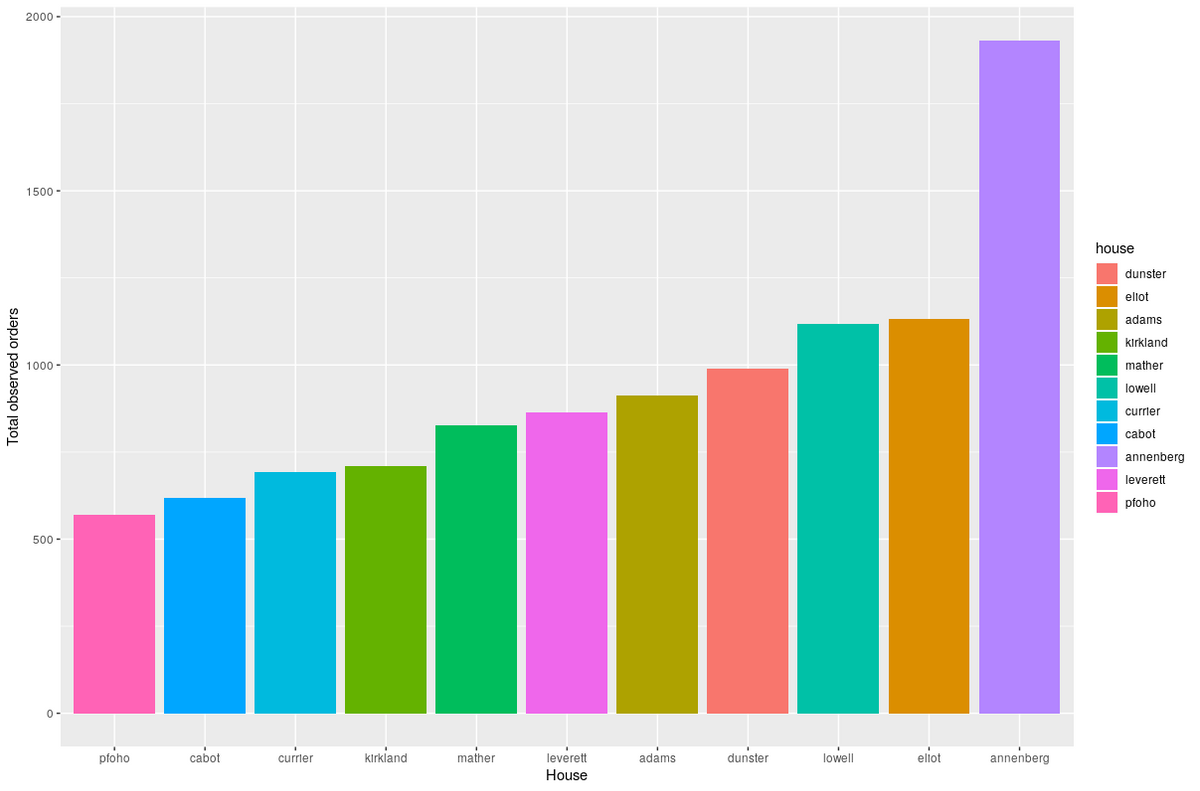
The most immediate observation is that Annenberg clearly dominates all other dining halls in terms of order volume. This makes sense, since Annenberg is home to the entire freshman class, and therefore accommodates many more diners than any of the other dining halls. To prevent variation in house sizes from affecting our analysis, we can also examine dining traffic normalized by house population (as provided by the Crimson):
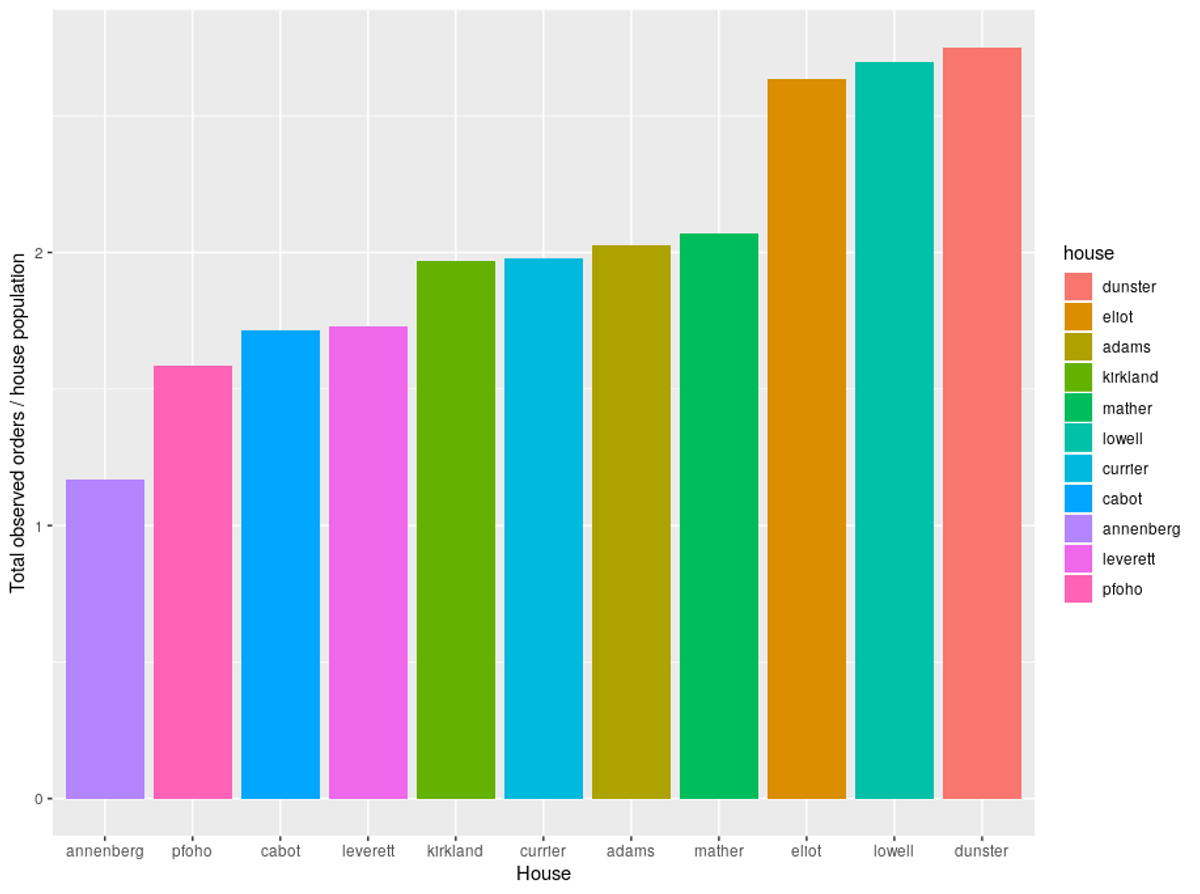
After normalization we see that Lowell, Eliot, and Dunster attract particularly large numbers of diners, while Pfoho, Cabot, and Leverett have fewer diners than would be expected for their sizes. It makes sense that Quad houses rank low on population-adjusted traffic, since many Quadlings choose to eat lunch at their sister houses by the river. Lowell may be a particularly favored dining locale due to its central location. However, traffic to the various houses is also undoubtedly influenced by meal quality, space, the habits of house residents, and other immeasurable factors. We can also break down house-specific demand for lunch and dinner separately:
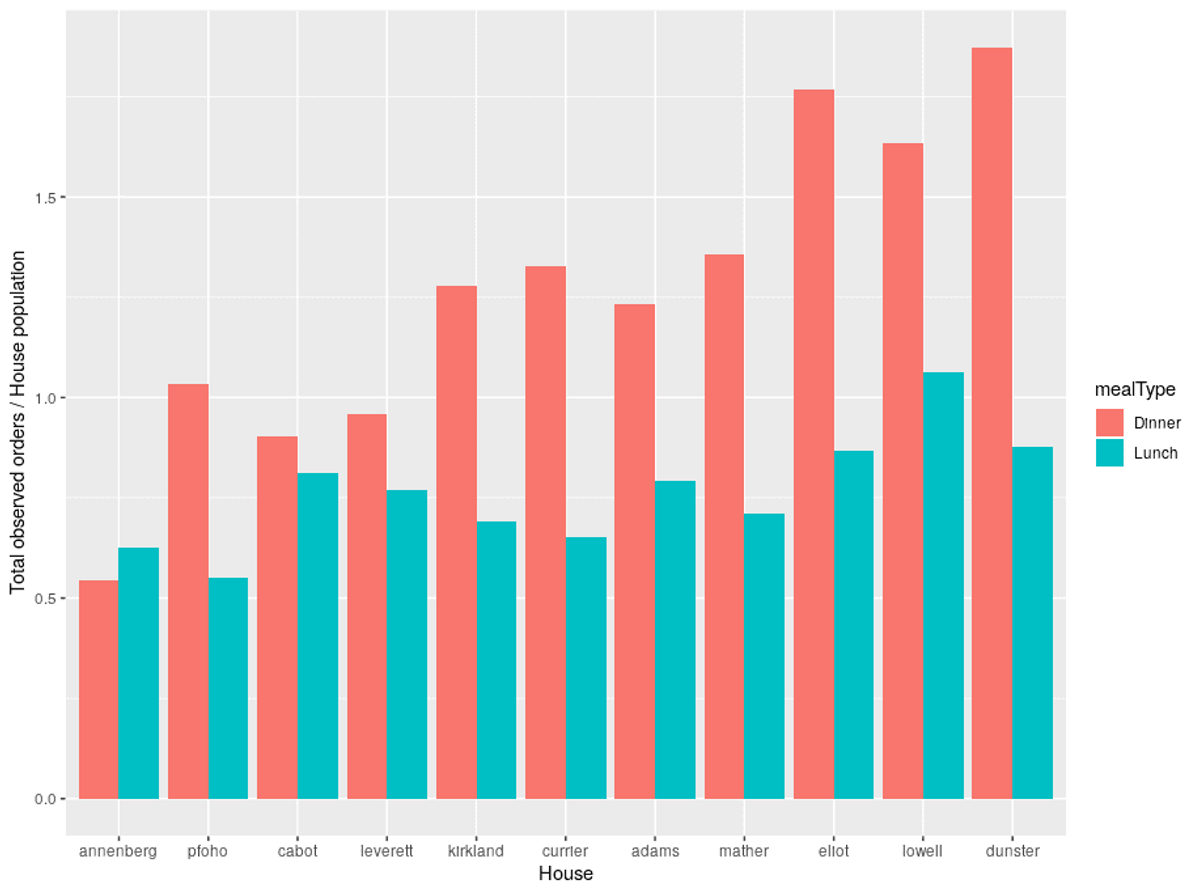
One interesting observation here is that Annenberg is the only house for which lunch orders exceed dinner orders. This makes sense, since Annenberg’s close proximity to lecture halls in the Science Center and elsewhere in the Yard makes it easy relatively easy to stop there for a quick meal between classes.
Methods and Data Collection
To assemble this dataset, we programmed an automated scraper to record the number of pending orders for each of the 12 house dining halls and Annenberg at 5-minute intervals throughout lunch and dinner each day. Scraping began on 20 October 2019 and has been running continuously since that date. The analyses in this article consider data collected between 10/20/2019 and 11/24/2019.
To set up our scraper, we identified a data server that Mange uses to disperse information to its web and mobile clients. It turns out that anyone can ping this data server and receive information, even without any access token or authentication. This made it straightforward to scrape this information using HTTP requests, without any need to bypass authentication barriers. The data server provides the raw count of pending orders at each house grill, which is converted to an approximate wait time using the peculiar formula T = .75(1.025N)N + 5.
Data Anomalies and Additional Considerations
First and foremost, it should be remembered that all of these analyses use grill orders as a proxy for dining hall traffic, so they are unlikely to perfectly reflect the habits of all Harvard diners. It is possible that a few “super-orderers” in each house account for a large portion of grill traffic, allowing for a relatively small population to influence the results of our analysis. That said, the qualitative conclusions drawn from the data appear to be consistent with our intuitions about Harvard dining, suggesting that grill orders are a reasonable proxy for dining traffic.
As mentioned earlier, Quincy and Winthrop are omitted from our current analyses. Quincy in particular reported unreasonably large order volumes, generating over twice as much traffic as the next largest upperclassmen house. We also recorded anecdotal accounts of the Mange app not working properly in Quincy, supporting our decision to exclude these data. Winthrop’s data do not contain such significant anomalies. However, we did observe some orders recorded from Winthrop during Thursday dinners, which should have been impossible due to grill closures during Bistro Bowl nights. We therefore excluded data from Winthrop as an additional precaution. It should be reiterated that the inclusion of these two houses does not affect the general trends observed in the data.
Conclusions and Future Directions
Through our analysis of order volume data scraped from the Mange app, we were able to characterize the general dynamics of dining hall traffic at Harvard. We discovered a distinct biphasic trend in traffic during lunch, which is likely due to the start and end of 12:00 PM classes. We also characterized the typical time course of dinner traffic and analyzed variation in order volume between houses. In addition to being of general interest, these data may prove useful for students trying to optimize their choices of dining halls and meal times to avoid long waits. If the trends discussed in this article prove robust after additional data collection and validation, they could even be used to plan shifts for dining hall workers so that employees don’t work unnecessarily long hours. As more data become available, it may be possible to find interesting associations between dining hall traffic and other variables like weather, exam schedules, and the daily HUDS menu.