
Measuring Gratitude in Harvard’s Dining Halls
Ordered from the grill recently? Did you say thank you?
“Oh, they always say thank you,” the quad house chef affirmed, with a smile spreading across her face.
At a river house the following week, a student leaned over the dining hall bistro bowls, his eyes bouncing between the Thai turkey meatballs and vegetarian “meatballs” for several seconds. Following deep contemplation, he took the vegetarian option and silently swiveled around to continue filling his dinner tray.
The chef standing behind the grill turned toward me with a scowl on her face. “Him…” she murmured while glancing in the student’s direction, “never.”
Introduction
Earlier this semester, I became curious about two dining hall-related questions during a dinner conversation with friends: First, do students in different residential houses say “thank you” to the Harvard University Dining Services (HUDS) staff at different rates? Second, can those differences in “thank you” rates be used to quantify relative levels of gratitude between the housing communities?
To answer these questions, I formulated a simple experiment.
Clearly, this is not a perfect experiment. Ideally, I could have sculpted a single standardized dining hall configuration for all of the houses and monitored all of them on a single day, simultaneously, with the same food, same music playing, same dining hall workers, and the same temperature and humidity.
Instead, I tried to standardize as many variables as I could. This meant that I only observed dining halls on Thursdays at dinner, for two main reasons. First, Thursday dinners are designated as “community nights” for seven out of the eight river houses (Lowell doesn’t allow guests between 6 and 7 pm and is closed to first year students), meaning that only students living in the house are able to eat in the dining hall that evening. By only studying the dining halls on community nights, I mitigated the risk that I observe a Quincy student in Kirkland House, for instance, and accidentally attribute that student’s behavior to the wrong house. Second, the food is standardized at the dining hall grills during Thursday dinners because the grill only serves “bistro bowls” — a specialized dish that varies from week-to-week — instead of the typical, wider grill selection. Because I would not be able to observe hundreds of grill pickups at each dining hall, I wanted to avoid having the relatively small samples that I observed in each house be distorted by variations in the types of food that people picked up at the grill.
Analysis
This figure shows the thank-you rates of all 13 dining halls and their respective 95-percent confidence intervals.
Because of the relatively large 95-percent confidence intervals, it is difficult to definitively determine which dining halls have the highest and lowest thank-you rates.
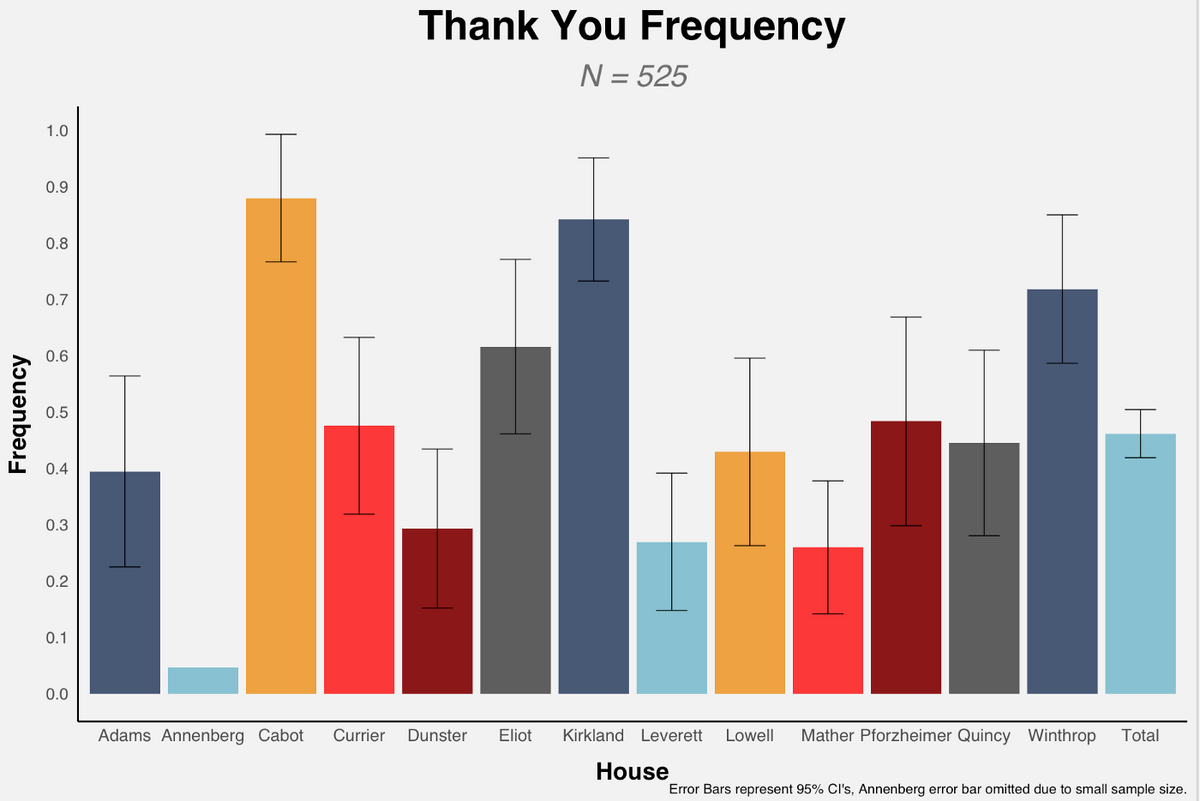
That said, Cabot House had the highest rate with 87.9% and had a thank-you rate that was statistically significantly higher than all houses other than Eliot, Kirkland, and Winthrop.
However, due to the overlapping confidence intervals, the true result could place other houses like Currier or Pforzheimer above Eliot and Winthrop.
Conversely, Annenberg — the first year dining hall — had a thank-you rate of just 4.65%. However, because Annenberg only had 2 “thank yous” (out of 43 pickups), I cannot say that Annenberg had a thank-you rate that was statistically significantly lower than the other houses. Statistical significance requires that the number of pickups without a thank you (nq) and the number of pickups with a thank you (np) are both greater than 10.
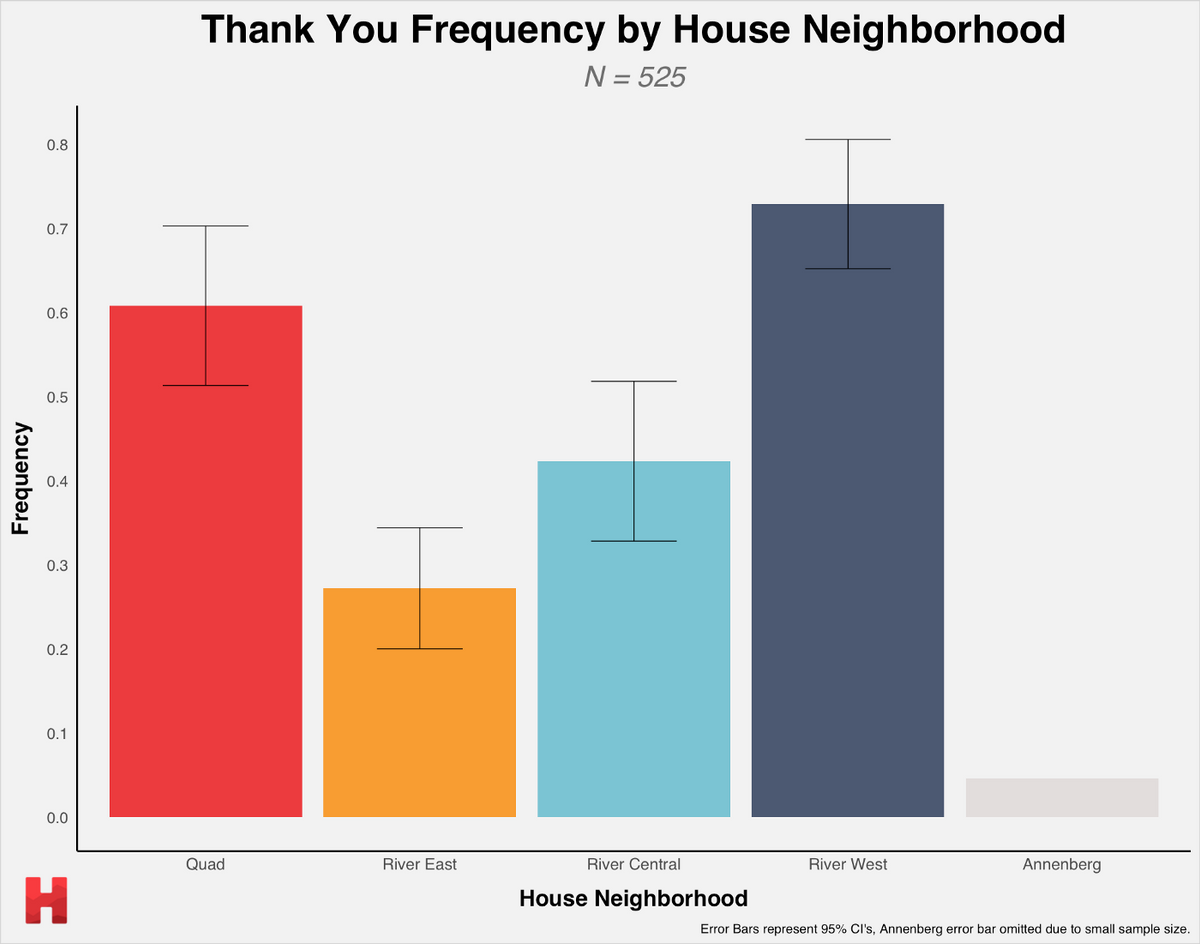
Of the four upperclassmen house “neighborhood” groupings, River West (Eliot, Kirkland, Winthrop) had the highest average thank-you rate in this experiment with 72.9%, but it was not statistically significantly higher than the Quad (Cabot, Currier, Pforzheimer).
Meanwhile, River Central (Adams, Lowell, Quincy) was not statistically significantly higher than River East (Dunster, Leverett, Mather).
However, because my sample size for each house in the experiment was not proportional to the number of students belonging to that dining hall, I contacted the Harvard College Office of Residential Life to figure out the number of students in each house (and the number of first year students) so that I could create a weighted average.
By weighting the thank-you rate of each house by its percentage of the total student body, I constructed a weighted average that more accurately reflects the college-wide average thank-you rate.
Experimental Design Considerations
An important caveat is that these findings may overstate the differences in students’ gratitude between the houses.
This is because there are several inherent problems with this experimental design that could have distorted the thank-you rates between houses, and I could only partially control for the effects of some of them.
First, I received help from multiple friends to observe all of the dining halls over the semester, meaning that the observer was not completely standardized between dining halls. This may have had an impact when observers used different definitions of whether a HUDS chef was close enough to the grill that a student could reasonably be expected to say “thank you” to them. There was not a statistically significant difference in thank-you rates between dining halls entirely observed by me and the dining halls where I received help from friends — though there may have been significant differences between the rates in dining halls observed by different friends.
Second, the dish served in bistro bowls changed from week to week. Therefore, some variation between houses may be due to a certain house being observed on a night when the bistro bowl dish is appreciated by students to a greater or lesser degree. Also, some weeks had dishes with two options — such as the Thai turkey meatballs and vegetarian meatballs — which tended to instigate more interaction between students and dining hall chefs, as the students often sought clarification about which option was which. After a student had asked for clarification, it appeared that they were more likely to say “thank you” at the end of the interaction.
Third, some dining hall chefs were more likely to proactively engage with students who were picking up bistro bowls. This seemed to boost thank-you rates.
Fourth, some chefs ensured that several bowls were always available for pickup to accommodate high demand, while other chefs made the bowls on an individual basis only when a person approached the grill. Those chefs that did the latter seemed to have higher thank-you rates.
Fifth, the layout of the bistro bowl pickup location varies slightly from house to house. This was especially apparent in Annenberg, where a glass barrier separates the students from the HUDS worker who places down the bistro bowls. Also, some dining hall grills had long countertops where chefs distributed the bistro bowls in a wide line along them; other countertops were narrow, so that students — on average — were closer to the HUDS chefs while they picked up their bistro bowls. These narrower bistro bowl distributions appeared to spark more thank yous from students as they were closer in proximity to the HUDS chefs.
Sixth, the observations taken in the quad houses may have included some river house students because quad houses do not restrict who can eat in the dining halls during Thursday dinners. Additionally, some students are able to dine in river houses other than their own on community nights (due to staff leniency or students sneaking in) despite the restrictions, so there may be some “cross-pollination” of student behavior.
Seventh, even though the experiment observed 525 total pickups that took place when HUDS staff were present, the sample size observed for each house was somewhat limited. The average house sample size was 40.4 pickups, with the smallest individual house’s sample size being 29 pickups.
Eighth, my observations in different dining halls occurred at different times over the 5:00 to 7:15 PM dinner period. Therefore, any differences in gratitude between students who eat dinner earlier versus later in the dinner time slot could affect the thank-you rates that I observed between houses.
Ninth, eight of the dining halls had music playing by the grill, while the other five did not. Fortunately, the difference (41% in houses with music; 58% in houses without music) between houses with and without music were not statistically significant.
Conclusion
Ultimately, this experiment should not be interpreted as a critique of any house or group of students or HUDS staff members. Rather, I think this experiment should serve two purposes.
Second, this experiment should serve as a nudge to Harvard students to be openly grateful to HUDS staff members when we appreciate the work they do for us.
They prepare our meals, they clean our dishes, they mop up our spills, and they share our space, conversations, and lives if we engage with them. We should also express this gratitude to other workers at Harvard.
Hopefully, future experiments can better pinpoint ways that we can improve interactions between Harvard students and HUDS staff members. Harvard University Dining Services, I welcome your help in this process.
Thank you to James Allan, Kevin Bi, Rameen Rana, Heide Rogers, and Divya Vatsa for their help observing dining halls.
Thanks also to Seth Billiau for his help with the charts in this article and the Harvard College Office of Residential Life for providing up-to-date counts of the number of students in each house. Lastly, thank you to all of the kind HUDS staff members who graciously accommodated my loitering for this observation experiment.