
Inside Schedule R: Mapping Harvard’s Organizational Network
Beyond endowment numbers and tuition revenue, Harvard’s IRS filings reveal the lesser-known entities that manage property, investments, and operations worldwide.
Inside Schedule R: Mapping Harvard’s Organizational Network
Beyond endowment numbers and tuition revenue, Harvard’s IRS filings reveal the lesser-known entities that manage property, investments, and operations worldwide.
Introduction and the Question
Every year, Harvard files a Form 990 with the Internal Revenue Service (IRS), which provides a public view of the University’s finances, governance, and sprawling network of related entities. When we look into news headlines, most coverage of Harvard’s financial disclosures tends to focus on the size of its endowment or executive compensation. At the same time, less attention is paid to Schedule R, the section that lays out Harvard’s relationships with “related organizations” and “controlled entities.” These disclosures reveal the corporate structure behind the University—from wholly-owned subsidiaries that manage real estate or investments to joint ventures with other institutions across the globe.
In this project, we seek to answer a few questions: what entities does Harvard control, and how do those structures matter for how the University operates? We are also curious about people's assumptions about Harvard’s investments—especially in certain countries or industries—compared to what R shows. By unpacking this often-overlooked part of the 990, we aim to shed light on Harvard’s role not just as a university, but also as the hub of a complex organizational network that supports its academic mission, manages its finances, and extends its reach beyond Cambridge.
The Data and Our Methods
Our data comes from the 2022 IRS Form 990 filed by the President and Fellows of Harvard College, which is publicly available through the IRS and nonprofit data repositories. Specifically, we focused on Schedule R, which documents Harvard’s related tax-exempt organizations, partnerships, disregarded entities, and controlled entities. This dataset is based on official financial filings and compliance requirements, making it a reliable source for structural insights. For a more detailed categorization of the controlling entities in Harvard’s Schedule R, check out the appendix.
Our method began with extracting Schedule R from the filing using the Python library PDFPlumber (documentation details: https://github.com/jsvine/pdfplumber), which allowed us to download a clean CSV file. We then identified the different categories of entities listed and examined patterns in ownership and control by uploading the CSV file onto Datawrapper to visualize.
The Insights
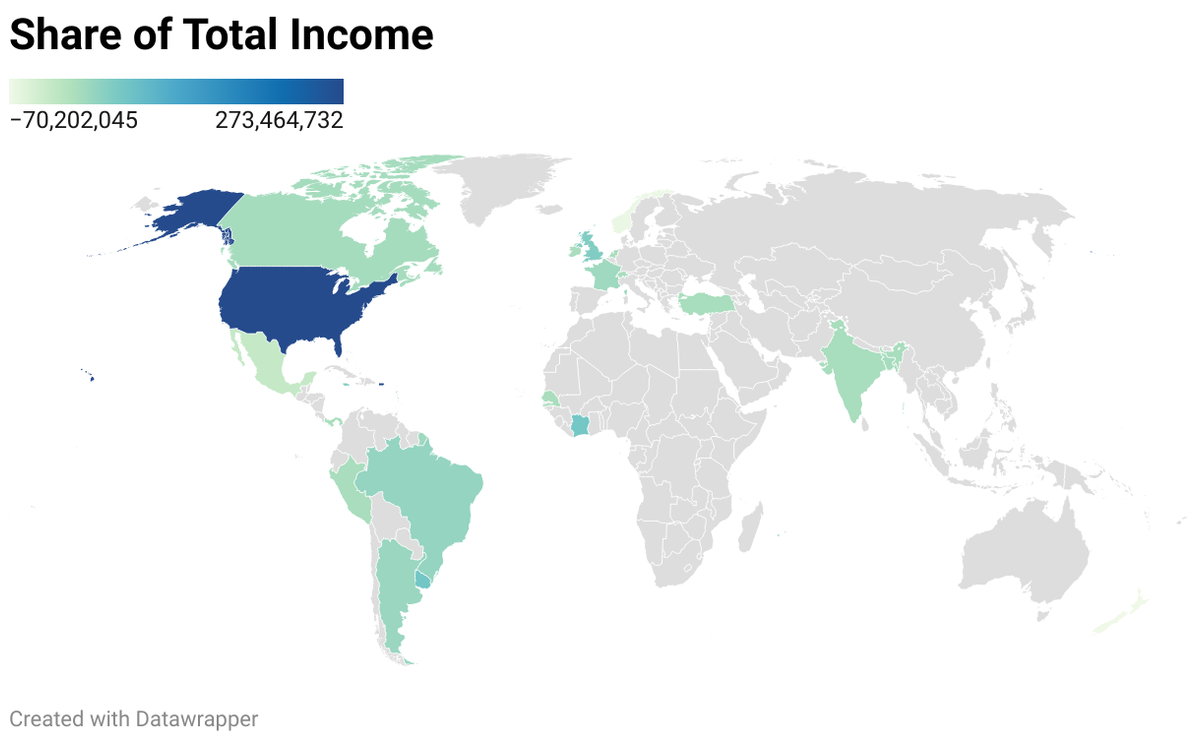 Figure 1
The above choropleth delineates the distribution of Harvard’s net income spent (positive) on and received (negative) from its controlling entities. Unsurprisingly, the largest generator of positive income is the US ($273,464,732 in 2022): 78 Harvard-related organizations are located in America. This reflects Harvard’s long-standing investments in local entities, which have had the time to develop into profit-generating organizations. In contrast, New Zealand demonstrated the lowest share of total income (-$70,202,045 in 2022), indicating a net financial loss. Whereas the U.S. benefits from a broad base of long-standing, income-generating entities, New Zealand’s outcome stemmed from Harvard’s lone sizable investment of $217,545,722 by the end of the year (EOY) in C Corporation DT1 Ltd. Because the investment is so recent, it has not yet produced sufficient revenue to offset the initial expense.
Hence, it is interesting to study the distribution of regions (excluding New Zealand) with negative net incomes: these span Mexico (-$27,854,827), Niue (-$64,664,574), Peru (-$37,657), and Senegal (-$104,577). While further investigation would be required to confidently conclude, a sensible deduction would be that these indicate a recent trend of Harvard investments in the aforementioned countries, and that these should reverse in the next few years, should Harvard not continue to make new investments into these regions.
In contrast, the three biggest profit generators are Uruguay ($47,512,630), the Ivory Coast ($45,925,777), and Great Britain ($34,154,263), which reflects the length of investments into these countries. Of particular note is the magnitude of investments into controlling entities based in Great Britain ($1,049,429,448 EOY, 2022), which may indicate Harvard’s preference to make investments in the UK.
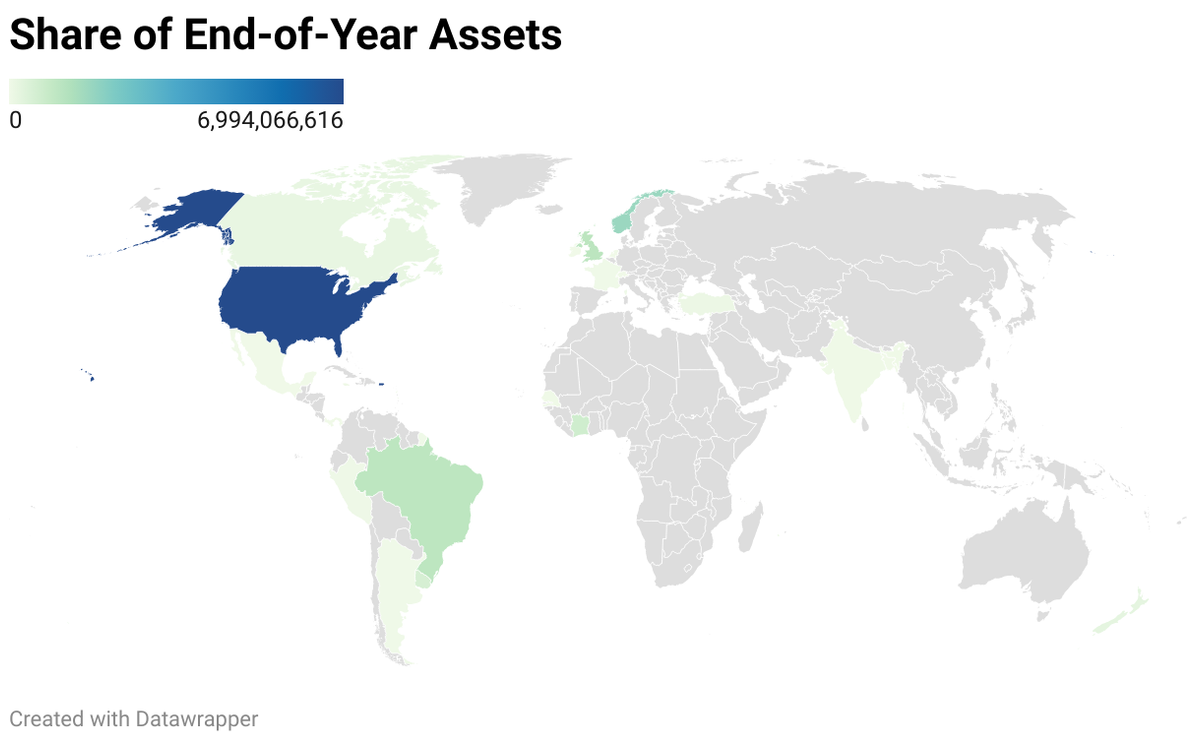 Figure 2
Much the same as the previous choropleth, the above diagram shows the end-of-year asset distribution across regions. Whereas the share of net income is more representative of the recency and/or success of Harvard investments, EOY assets simply indicate Harvard’s preference for investment location.
Apart from its investment in US-based entities ($6,994,066,616 EOY, 2022), Harvard’s largest investments are in Jersey ($3,514,105,943), Niue ($1,679,920,267), and Great Britain ($1,049,429,448), which indicates the countries in which Harvard places most of its confidence to generate higher investment returns. It is also worth noting that there are a number of countries in which Harvard reportedly has no investments; in fact, there are few countries in which Harvard does have any investment. It would be a worthwhile follow-up to investigate the reasons for each country, be they political or economic.
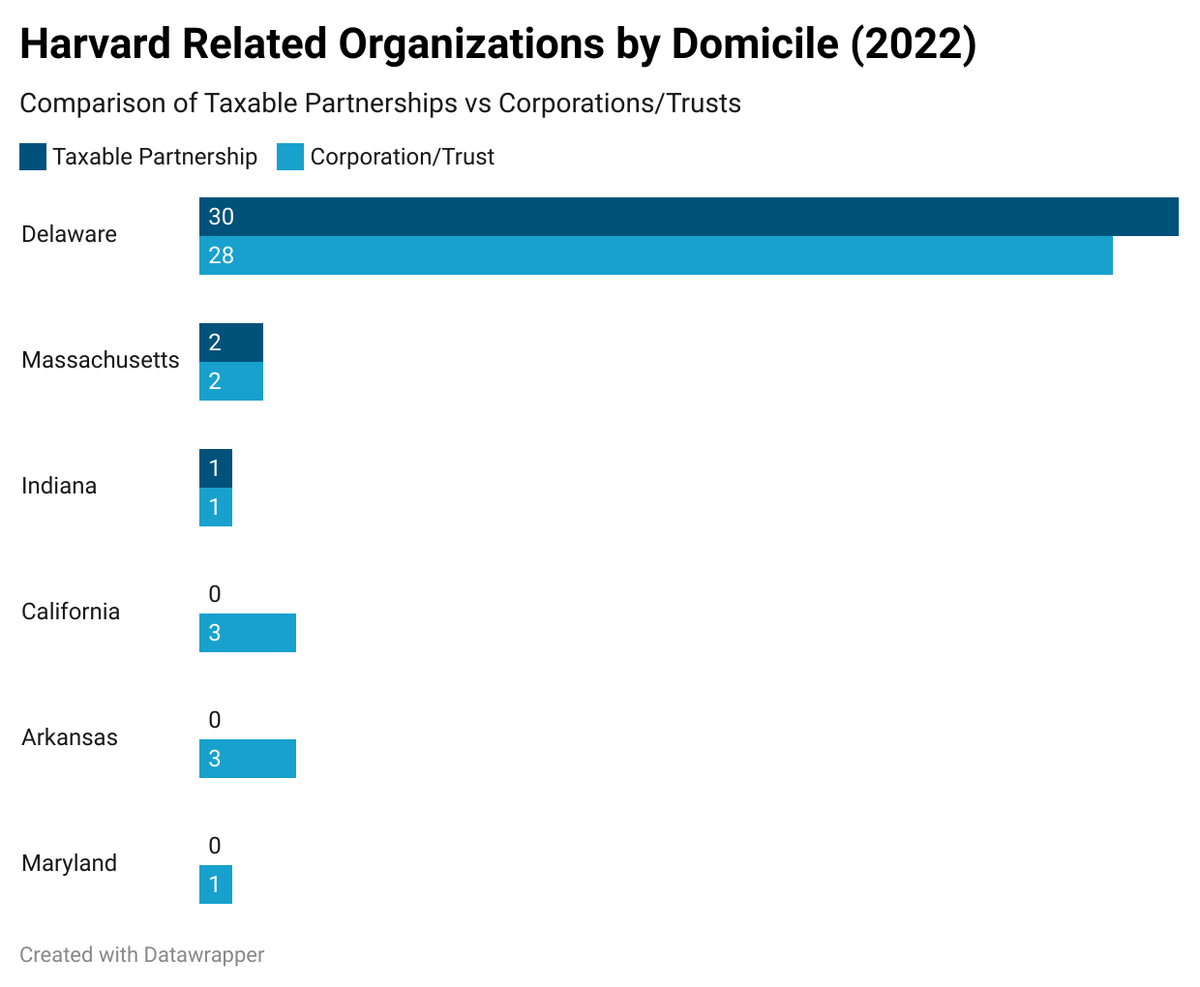 Figure 3
This chart compares the number of taxable partnerships and corporations/trusts across the U.S. The results show an overwhelming concentration in Delaware, which houses 30 partnerships and 28 corporations/trusts and contributes to more than 85% of all such Harvard entities (net). On the other hand, Massachusetts accounts for only 4 of the taxable and trust entities. This distinction illustrates that Harvard’s choice of Delaware is not based on where these organizations’ operational addresses are, but rather an intentional legal and financial strategy to minimize university tax spending. Delaware is known for its corporate-friendly laws, efficient courts, and tax advantages, and has long been favored by businesses for proper tax avoidance. Instead of spreading across the country, these organizations are strategically clustered in Delaware, showing that Harvard operates in a manner that is similar to large corporations or investment firms rather than traditional nonprofit universities.
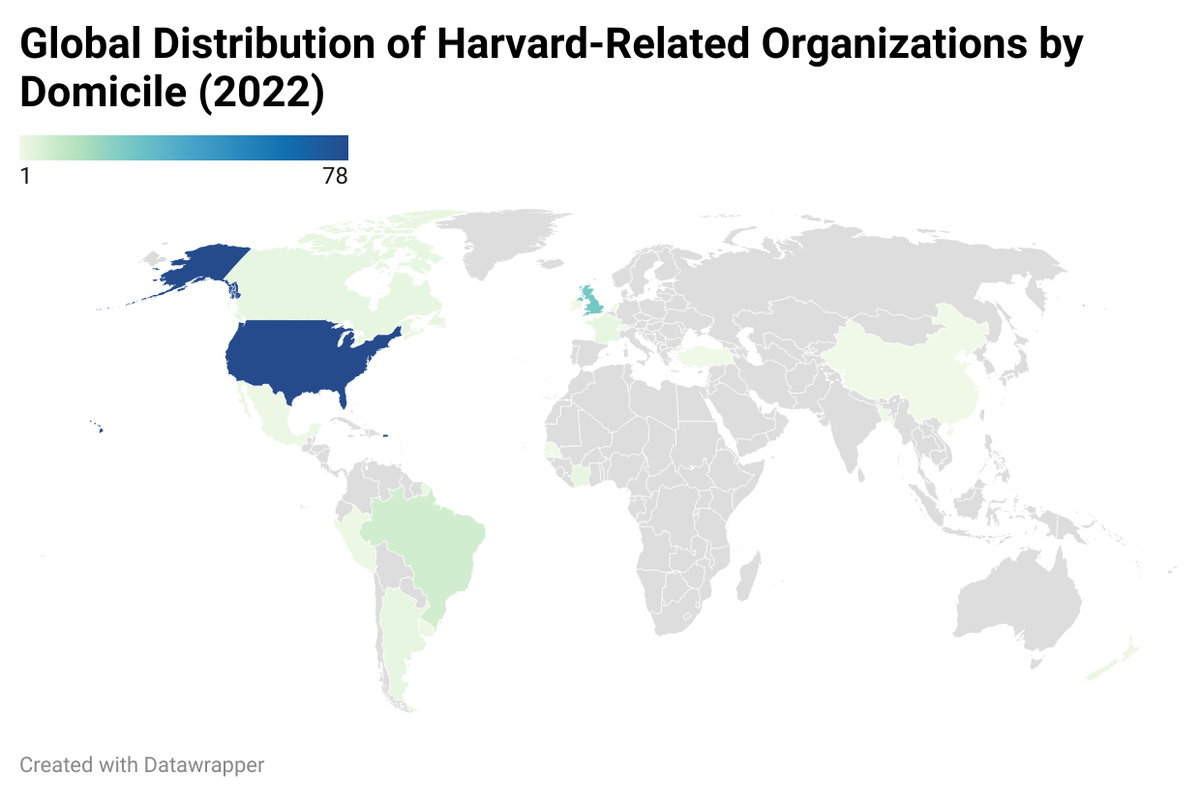 Figure 4
Building on the past two choropleths, the above demonstrates the global distribution of Harvard-related organizations by domicile. The United States is by far the most dominant region with 78 entities, showing that Harvard’s operation is primarily within the country. The second largest concentration is based in the United Kingdom with 27 entities, many of which are actually tied to offshore financial territories such as the Cayman Islands and Jersey. The two domiciles, both provide highly favorable financial environments, account for most of Harvard’s overseas network.
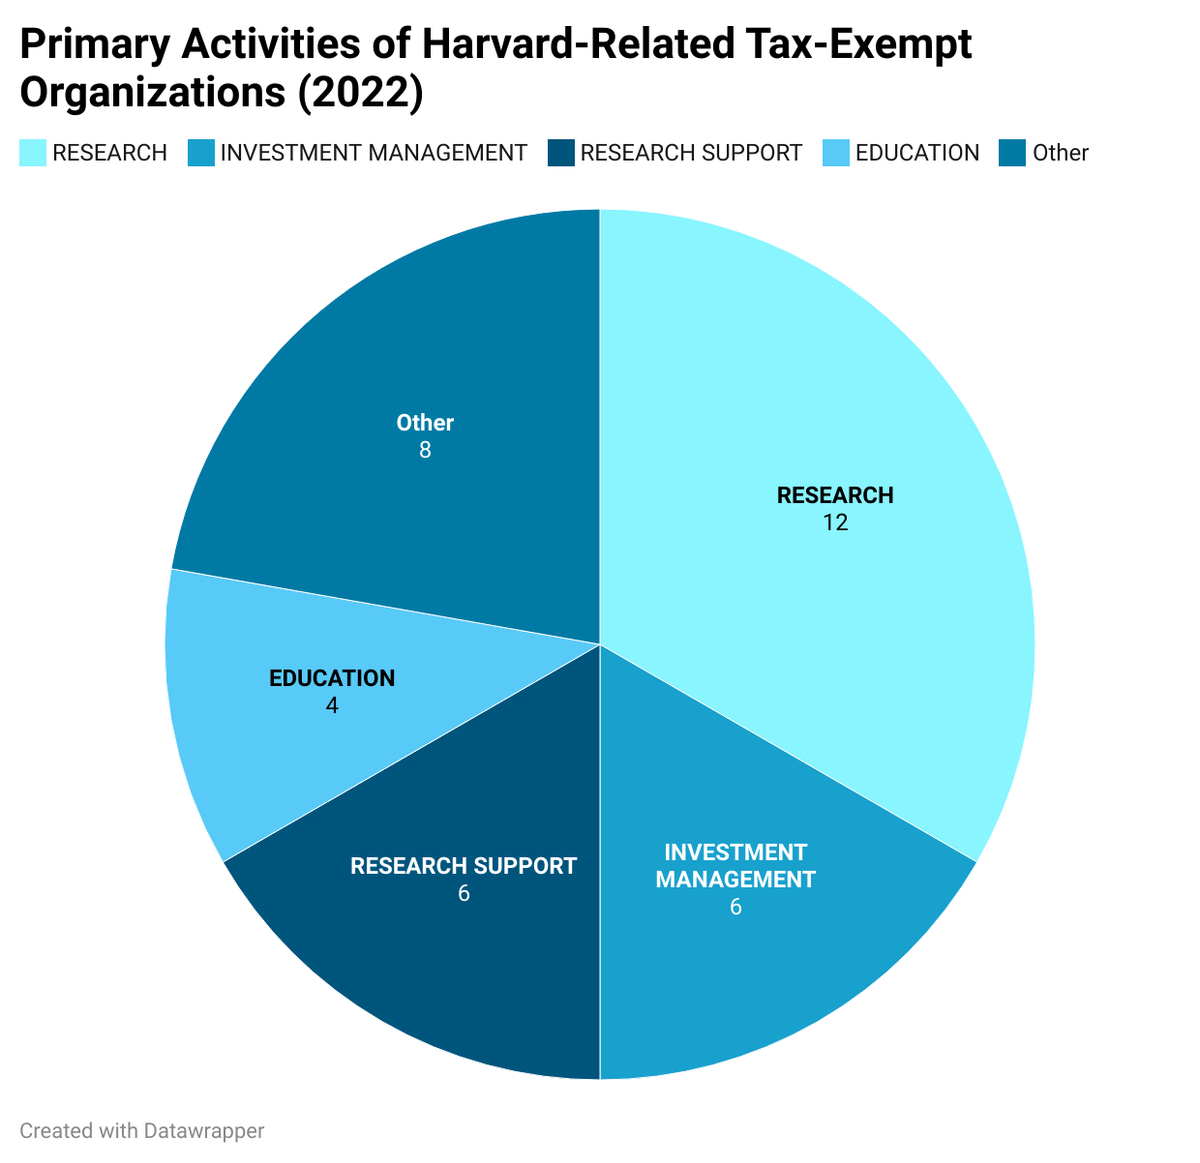 Figure 5
The above pie chart is crucial for understanding the activities Harvard values as important investment opportunities. Logically, research or research support spans 50% of Harvard’s investment categories: while Harvard’s investment mandate is primarily focused on providing perpetual support to the university, Harvard Management Company (HMC) also integrates a focus on furthering research and educational causes through its investments, thereby reinforcing the university’s position as a leader in academic advancement. This dual focus of balancing financial stability with a mission-driven mandate differentiates HMC from typical asset managers. Additionally, the “Other” category contains student support (2), publishing (2), medical education (2), athletics (1), and energy services (1).
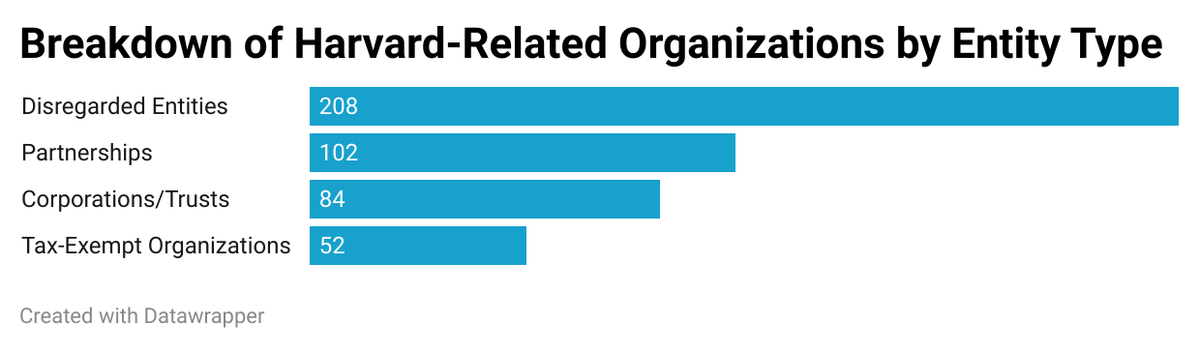 Figure 6
With nearly 450 related entities, Harvard’s endowment is structured more like a multinational conglomerate than a single nonprofit. While the main reason for this investment strategy is the diversification flexibility such a large endowment provides, it is also worth noting that HMC also spreads out its investments to honor donor restrictions and meet regulatory requirements.
Disregarded entities are by far the largest category of related entities, indicating that Harvard uses many single-member LLCs and similar entities to hold its assets. These roll up to Harvard for tax purposes while providing legal separation benefits. Hence, it is apparent that Harvard relies on these disregarded entities as “investment wrappers” to provide liability protection and regulatory compliance.
The large number of investments in partnerships (102) also indicates HMC’s preference to invest in alternative investments through joint ventures and/or limited partnerships: these structures enable Harvard to invest in long-term, illiquid assets, thereby diversifying its portfolio to lower investment risk.
Unanswered Questions and Future Work
While the IRS 990 filing is meant to be comprehensive, there are inevitably pieces of information (such as small investments, undisclosed investments) that may have been omitted, and a deeper investigation into how the filing correlates with Harvard’s financial statements may indicate whether such discrepancies exist.
Similarly, much of our investigation has been into the what of HMC’s investments, rather than into the why. For example, we note the various countries whose controlling entities have positive and negative net incomes, and while we do suggest reasons for these variations, a concrete contextual explanation would still be desirable.
Finally, our investigation is standalone in nature: it does not consider how Harvard’s investments have changed throughout the past few years. Hence, the reasoning suggested for some of the trends identified may not be accurate. For example, it may be that New Zealand’s net income generation has been negative for many years: this would suggest either that Harvard is constantly making new investments into New Zealand-based controlling entities or that these investments have been largely unsuccessful for many years.
Conclusion and Significance
Primarily, Harvard’s Schedule R filings represent a complex operational model that more closely resembles a multinational investment firm, rather than a traditional nonprofit, as evidenced by the nearly 450 related organizations that span its controlling entities.
Geographically, the concentration of controlling entities in the US and UK, and the strategic use of jurisdictions such as Delaware and the Cayman Islands, are suggestive of HMC’s deliberate effort to leverage the favorable tax environments these regions provide. The large distribution of entities, from disregarded entities to tax-exempt organizations, also illustrates how Harvard balances its mission to generate sustainable investment returns while managing its fiduciary responsibilities.
Ultimately, our investigation serves to demonstrate how Harvard deploys its endowment and gives suggestions as to why it distributes its investments in the way it does. As a university, Harvard’s principal mandate is to further its academic missions, and it does so through shrewd financial stewardship, as demonstrated by its nuanced and effective investment mandate.
Appendix
Disregarded Entities
Harvard sets up disregarded entities when it wants the operational flexibility of a separate legal entity without creating a separate tax identity. These are essentially extensions of Harvard, with all assets and income flowing back to the University itself. Many of them handle real estate, such as Beau Geste XXV LLC, which holds major property investments and is likely involved in Harvard’s campus development strategy, or Harvard 219 Western LLC, which supports development in Allston. Others serve specialized purposes, such as HUH Brokerage Services LLC, which manages real estate transactions, or Harvard International LLC, created for global support functions. By structuring them this way, Harvard can manage projects more efficiently and still keep everything under the direct control of the University.
Tax-Exempt Organizations
These nonprofits hold their own status but are firmly tied to Harvard’s mission. They often expand Harvard’s academic, cultural, and research footprint both in Cambridge and worldwide. For example, the American Repertory Theatre Company enriches Harvard’s arts ecosystem and provides learning opportunities for students. The Botswana-Harvard AIDS Institute collaborates with local partners to advance critical health research in HIV/AIDS in southern Africa. On the financial side, Blue Marble Holdings Corp and Demeter Holdings Corporation help manage and hold investments on behalf of Harvard. There are also global academic partnerships, such as the Dubai Harvard Foundation for Medical Research or the Fundación DRCLAS Chile, which deepen Harvard’s international collaborations. Together, these nonprofits make Harvard’s reach broader than the physical campus, connecting students, faculty, and researchers to opportunities across the globe.
Partnerships
Partnerships are where Harvard operates like an investor, often through Harvard Management Company or its subsidiaries. These arrangements give Harvard stakes in real estate projects, private equity funds, and other pooled investments. Examples include 144 Fulton MMEE JV LLC and 170 Broadway LLC, both tied to New York real estate, and Apollo Thunder Partners LP, which represents a private equity investment. Harvard also participates internationally, like in the 3D Investment Value Master Fund registered in the Cayman Islands, which reflects the University’s global investment strategy. While they don’t carry out teaching or research directly, these partnerships grow the endowment, which is oftentimes the financial engine behind scholarships, faculty support, and Harvard’s long-term stability.
C Corporations
C corps are the most common structure Harvard uses when it sets up taxable subsidiaries. These entities are separate legal and tax-paying corporations, often used to hold real estate investments, manage international funds, or participate in partnerships that require a corporate form. For instance, Atlantic Regent REIT Inc. and Atlantic P3 Program REIT Inc. are corporations set up as real estate investment trusts (REITs). Their job is to own and manage property investments on Harvard’s behalf. The income and value from these real estate holdings are folded back into Harvard’s overall investment portfolio. Another example is the 3D Investment Value Fund, a large offshore investment corporation that reflects Harvard’s presence in global markets. Even though these entities pay taxes, they exist to generate returns that ultimately support Harvard’s endowment.
S Corporations
Unlike C corps, S corps are designed to pass income and losses directly to their shareholders instead of paying corporate income tax. Harvard uses them sparingly, since S corporations can’t have many shareholders and come with strict eligibility rules. When Harvard does employ them, it’s usually for small, targeted investments or joint ventures where the pass-through tax treatment makes reporting simpler. For instance, entities like ASH R One LLC and Atlantic P3 TRS LLC are structured this way within Harvard’s investment system. They act as lean vehicles for specific real estate or project-based holdings where Harvard benefits from the lighter tax framework.
Trusts
Trusts in Harvard’s structure are less about day-to-day operations and more about stewarding funds and assets in a way that ensures long-term benefit to the University. They allow Harvard to keep certain resources legally distinct, managed under fiduciary rules, and aligned with a donor’s intent or investment strategy. For example, Harvard reports related trusts that are tied to specialized investment funds or property holdings. One illustration is the Black Kite Trust, which acts as a holding arrangement for assets tied to Harvard’s investment system. It’s worth noting that some entities with “trust” in their name actually appear under the C corporation category in Schedule R. That’s because the IRS groups them by how they’re taxed, not just by their title—certain investment trusts function more like corporations for tax purposes, so they are classified as C corps even though the word “trust” appears in their name. By placing resources in trusts—whether traditional fiduciary trusts or corporate-style investment trusts)—Harvard ensures those assets are insulated, managed prudently, and directed toward the University’s long-term mission rather than being folded into its general operating accounts.