
Harvard’s Endowment: Is it as high-performing as we think?
How does Harvard's endowment performance compare to other schools?
Introduction
A subject of fascination for news articles and tourists, a fruitful topic for memes, and the source of more than half of Faculty of Arts and Sciences income — Harvard’s endowment is all of these things and more. But is it as high performing as we are led to believe? In this article we compare Harvard’s endowment performance to other schools (in particular Ivy League+ schools), and then consider why the returns might be different.
Data
For the first part of our investigation (endowment growth) our primary source of data is a list of endowment sizes of all private schools with endowments worth more than 1 billion USD between 2007 and 2019. This data is collated from NACUBO (National Association of College and University Business Officers). For the second part of our investigation our primary source was the official financial reports of Ivy League+ schools. We used this to calculate the raw endowment returns - the investment returns of the endowment independent of gifts and withdrawals.
Findings & Significance
Endowment growth
As a result, the endowment does not grow significantly during this time period, expanding only from $34 to $39 billion (a 14% increase). For comparison, Yale’s endowment grows by 35%, averaging a 3.1% annual growth, and UPenn’s endowment more than doubles from $6.2 to $14.7 billion.
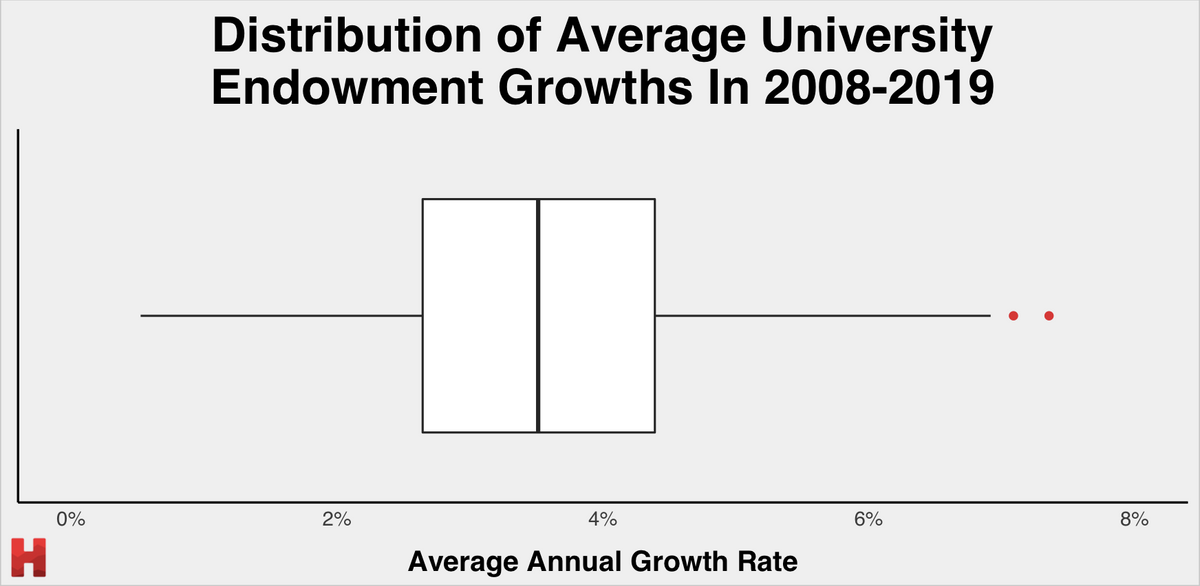 Harvard’s average annual endowment growth rate of 1.8% in 2008-2019 falls in the bottom 25% of all major private schools’ endowment growth rates.
We investigate three possible explanations for Harvard’s comparatively poor average endowment growth.
One reason may be that Harvard is distributing more funds from the endowment, and so, despite high returns, the endowment does not grow as quickly as other peer institutions’. To investigate this hypothesis we looked through financial statements for Ivy League+ universities to determine their endowment spending rates. Although the rates varied by year, they are remarkably similar across these peer schools — in the region of 5% with little variation, and so are too small to explain more than a percentage point (and likely less) of the differences we see in endowment growth.
A second possible explanation is that Harvard is just receiving fewer donations relative to its endowment size compared to peer institutions. We do not investigate this idea deeply, but estimate its size at the end of the article. The final possible reason for the lower growth we see is lower investment returns of the portfolio itself. We investigate this explanation in more detail.
Raw financial returns of Harvard compared to other Ivy League+ schools
Average annual returns between 2009 and 2020 are 5.6%, in the bottom quartile of all portfolio returns and only better than Cornell’s investment performance.
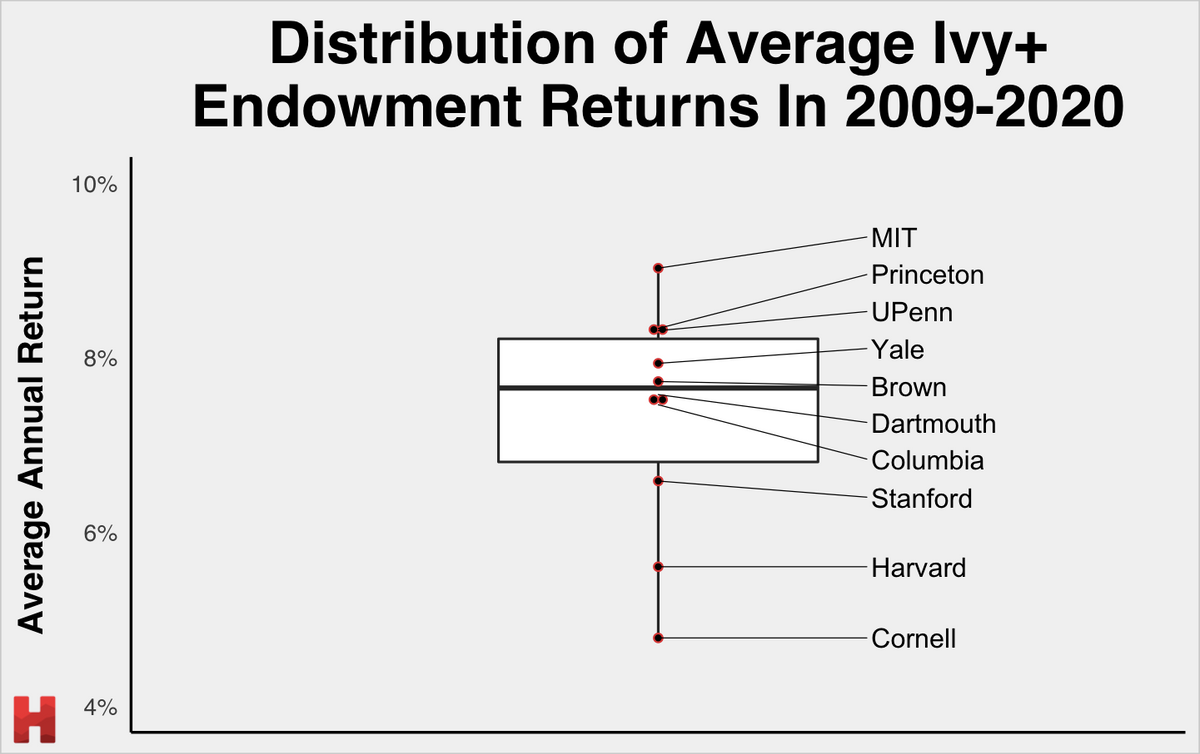 Harvard’s average endowment returns in 2009-2020 are among the lowest in Ivy League+ schools, standing higher only than Cornell’s.
We consider two hypotheses that can potentially shed light on Harvard’s low endowment returns compared to peer schools.
The first one revolves around risk. A tradeoff between risk and returns is well-known in finance, so we hypothesize that Harvard was aiming to have a less risky portfolio, which would lead to more predictable — albeit lower — annual returns. On the other hand, a riskier portfolio, theoretically, would be associated with potentially higher, yet more uncertain returns.
However, when we look at the actual risk and historic average endowment returns among peer institutions, we observe that, in fact,
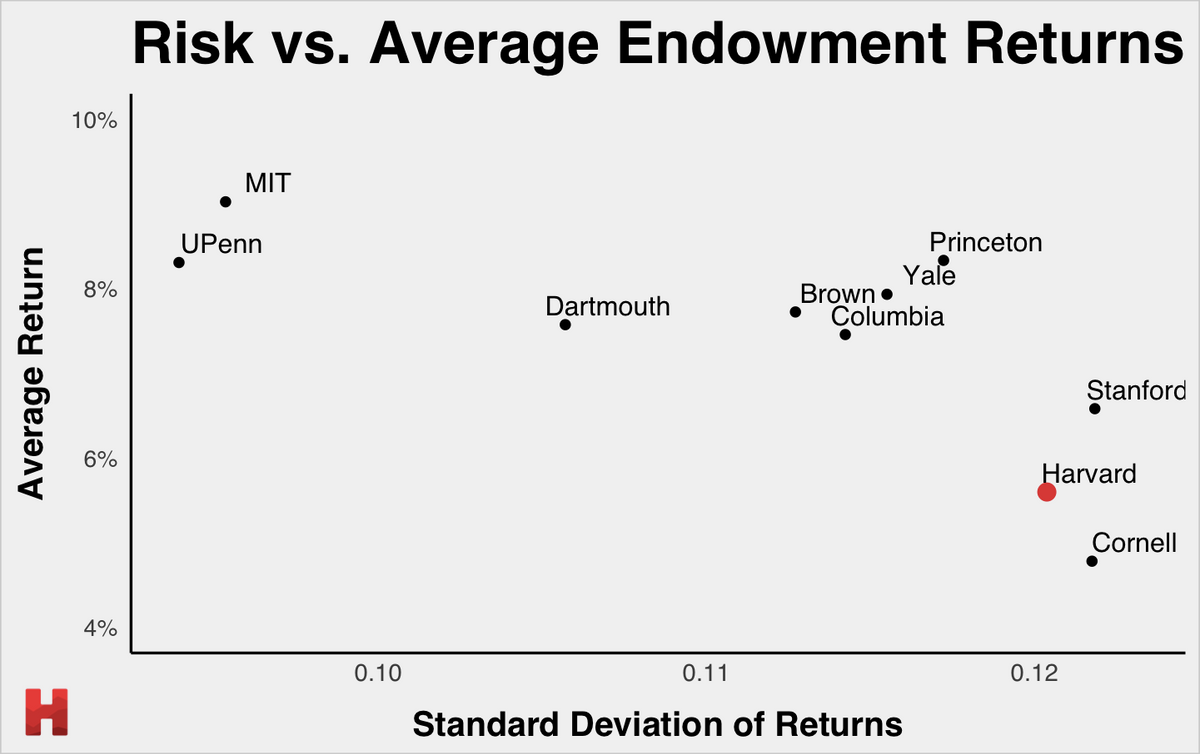 Despite being one of the “riskiest” (as measured by high standard deviation of returns), Harvard’s investment portfolio delivered among the lowest average returns compared to Ivy League+ schools.
Interestingly, the relationship between risk and return during this time period is not at all what we expected. Schools with the safest portfolios (MIT, UPenn) exhibit the highest average returns, while those with the riskiest portfolios (Harvard, Cornell, Stanford) are on the lower side.
Therefore, we can conclude that
Our second hypothesis for the low returns is related to asset allocation. We compare Harvard’s endowment allocation to that of MIT and UPenn — the two universities with the highest returns in 2016–2020 — and determine the extent to which the asset allocations across these three endowments could predict their endowment return. In particular, we explore data on how these three universities allocated capital between public equity, private equity and absolute return (hedge funds).
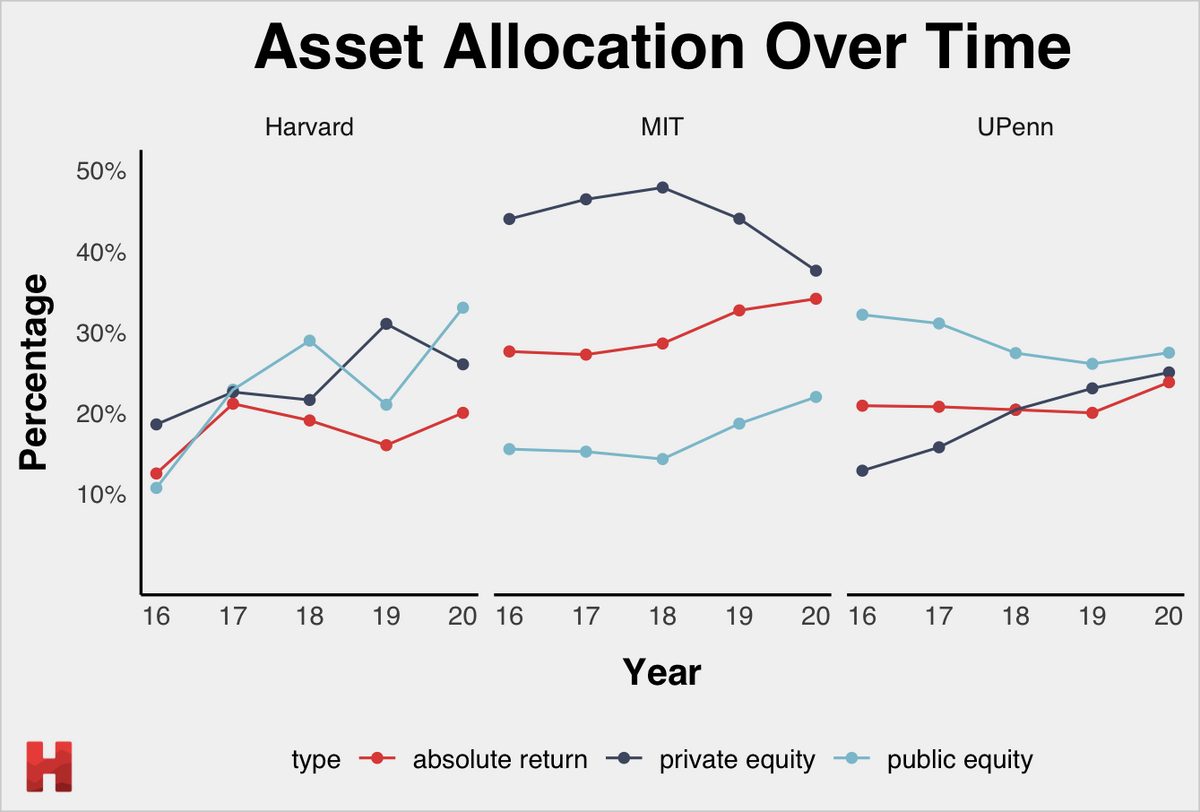 Comparison of asset allocation between Harvard, MIT, and UPenn.
We see that, from 2016 to 2020, MIT consistently allocated more capital to private equity and hedge funds than either Harvard or UPenn. Harvard increased its allocation to all three forms of asset — a change likely associated with new leadership at the Harvard Management Company. UPenn decreased its public equity allocation during this time period while significantly increasing its private equity allocation.
Using a multiple linear regression analysis, we find that a significant percentage — 42% — of the variance in endowment returns can be explained by asset allocation alone. This suggests that a way for Harvard to improve its investment performance would be to mimic the asset allocation of higher-performing portfolios — a strategy it seems to be following between 2016 and 2020 as it has reduced its allocation of other asset forms not shown on the graph here (e.g. real estate) and increased its weighting of absolute return, private, and public equity to more closely match the percentage allocated to these forms of asset as a whole by UPenn and MIT.
Conclusion
The conclusions from our analysis are stark - Harvard’s endowment has grown slowly, and its investment returns have been poor, partly due to asset allocation decisions. 3.5 percentage points of the 5 percentage points gulf in average annual growth between slow (e.g. Harvard) and fast growing endowments is explained by the difference in investment performance between Harvard and the highest-performing peer institutions (MIT, UPenn). Hence we can infer that the remaining 1.5 percentage points is the result of different donation rates, and perhaps slightly different spending rates by endowment.
You can check out the data used for this analysis here.