

How Election Outcomes Shape Trust in the Democratic Process
Existing public discourse suggests that people are more likely to perceive elections as fair when the outcome aligns with their personal preferences or political beliefs. Understanding the process of electoral trust is essential in explaining political polarization and reactions to election outcomes.
Introduction:
Existing public discourse suggests that people are more likely to perceive elections as fair when the outcome aligns with their personal preferences or political beliefs. This article sought to investigate the process underlying electoral trust. Understanding this process is essential in explaining political polarization and reactions to election outcomes. The main motivator for this study was people protesting at the Capitol over President Trump losing the 2020 election. Unlike most correlational studies that examine perceptions of fairness after real-world elections, this article employed an experimental manipulation of election outcomes to test the causal relationship between outcome favorability and perceived fairness under more controlled conditions. This allows for greater control and stronger inferences about causality due to there being fewer outside variables in this experiment than in real-world elections.
Methods:
Participants (N = 143) were recruited online from Prolific. All participants were of legal voting age (18+), and no exclusions were made based on their demographics. Participants reported data on gender, race, age, and political affiliations to support analysis and visualization of demographic-specific trends. Informed consent was obtained online through Qualtrics before participation began. No special populations were recruited.
This study used a cross-sectional, between-subjects experimental design, which allowed for a controlled test of how immediate election outcomes affect perceived trust in the electoral process. Participants were randomly assigned to one of two conditions: win (the participant’s chosen group wins, which is the control condition) or loss (the participant’s chosen group loses, which is the experimental condition). In the analysis of the data, I compared the mean values (represented by “M”) between the varying groups of people included in the survey.
The groups experienced identical procedures except for the manipulated election outcome. The participants were told that they were assigned to either the “Purple group” or the “Green group,” with group labels serving as arbitrary labels. To eliminate potential confounding effects from color preference, all participants were assigned to the Purple group. Hence, the only difference between conditions is whether the electoral results show that the group they voted for won or lost (either granting them a financial gain or granting the opposing group a financial gain). These two groups allow for a direct comparison of how experiencing a win or a loss influences their trust in the electoral process.
The primary construct of interest was trust in the election outcome. This was measured using a five-point Likert scale (1 = immense distrust to 5 = immense trust) in response to a survey question asking, “How much distrust or trust do you have in the results of the voting process?” This self-reported item was administered immediately after participants viewed the election result. Demographic questions followed. Although self-report responses may be influenced by factors such as social desirability or demand characteristics, anonymity and random assignment to outcome condition minimized these risks. Furthermore, the demographic questions came last to minimize the effects of possible stereotype threat affecting responses.
 Note: For the following data analysis and visualizations, only the categories with a substantial distribution will be used. Since Sex At Birth and Political Party have decent distributions of categories among the participants. Race and Ethnicity were not used due to the vast majority of participants being White and non-Hispanic.
Results:
Trust Ratings by Participant Sex and Condition
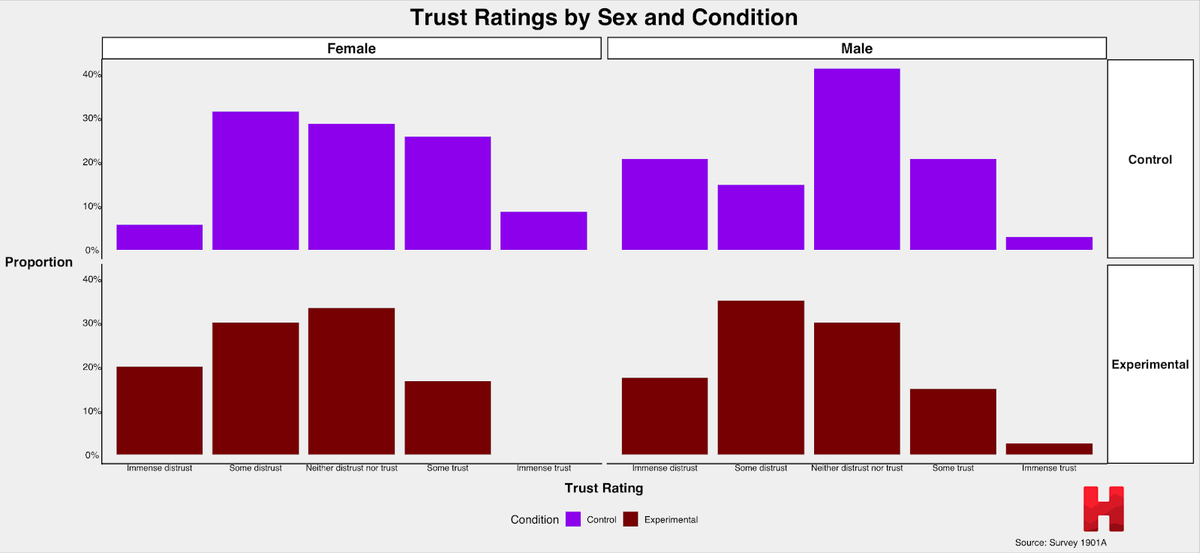 Figure 1. Rating scale for Trust ranges from “Immense distrust” to “Immense trust.” The purple bar graphs on the top row represent the Control group, while the red graphs on the bottom row represent the Experimental group. The two bar graphs on the left show the Female participants in each condition, and the two bar graphs on the right show the Male participants. The Y-axis is by proportion instead of count due to an unequal distribution of Female and Male participants (74 Male respondents and 65 Female respondents).
As shown in Figure 1, both male participants in the experimental group (M Male Experimental = 2.5, SD = 1.08) and female participants in the experimental group (M Female Experimental = 2.5, SD = 0.96) had higher ratings of distrust than those in their respective control groups (M Male Control = 2.74, SD = 1.01; M Female Control = 2.91, SD = 1.14; ). However, it appears as though the difference between control and experimental groups appears larger for female participants than male participants, suggesting a much larger shift towards distrust among women following an unfavorable outcome. A 2x2 (condition x sex) ANOVA revealed that while the effect of condition on trust rating was statistically significant, F(1, 135) = 3.88, p = 0.05, there was no significant effect of participant sex, F(2, 135) = 0.48, p = 0.62, nor was there a significant interaction between sex and condition, F(2, 135) = 0.44, p = 0.65. An exploratory follow-up post hoc test revealed that there was a significant effect of condition in female participants, t(135) = 2.02, p = 0.046 (no significant effect was observed in males). It should be noted that the Y-axis for this graph is proportion rather than count, as in Figures 1 and 2. This is due to there being slightly more male respondents (74) than female respondents (65).
Trust Ratings by Political Party and Condition
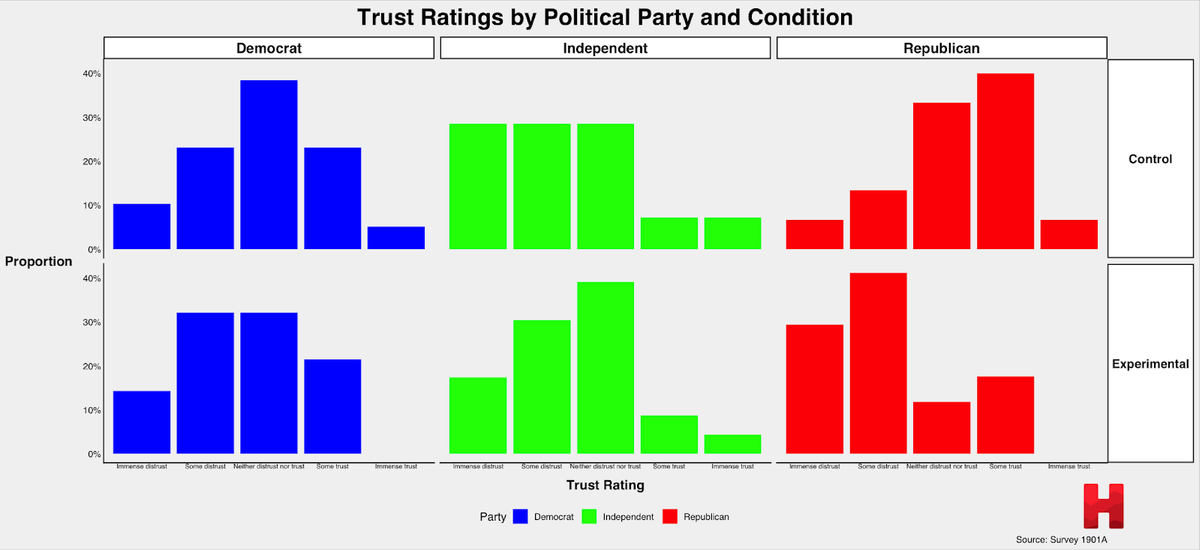 Figure 2. Rating scale for Trust ranges from “Immense distrust” to “Immense trust.” The blue bar graphs on the left represent Democrat respondents, the green bar graphs in the middle represent Independent respondents, and the red bar graphs on the right represent Republican respondents. The top 3 graphs are the respondents in the Control group, while the bottom 3 graphs are the respondents in the Experimental group. The Y-axis is by proportion due to there being an unequal distribution of participants by political party (65 Democrats, 31 Republicans, and 25 Independents).
With regards to political affiliations, Republicans showed a notable change in trust ratings across conditions, with higher trust when their candidates won (M Republican Control = 2.93, SD = 1.00, n = 15) and lower trust when their candidates lost (M Republican Experimental = 2.5, SD = 1.09, n = 17). Democrats showed a smaller shift (M Democrat Control = 2.68, SD = 1.05, n = 39; M Democrat Experimental = 2.47, SD = 0.98, n = 28) while Independents (M Independent Control = 2.95, SD = 1.17, n = 14; M Independent Experimental = 2.64, SD = 1.05, n = 23) generally have low trust regardless of the condition to which they were assigned. Taken more descriptively, Republicans had much higher trust in the voting process when the outcome was favorable and showed a sharper drop when the outcome was unfavorable, relative to the more modest shifts observed in Democrats and Independents. However, this interpretation should be taken cautiously because the sample size of Republicans within each condition was small, yielding low statistical power (power = 0.20; r = 0.20; p = 0.05. On the other hand, Democratic respondents had an almost perfectly normal distribution in the control group and trended towards higher ratings of distrust in the experimental group.
The 3x2 ANOVA revealed that political party alone had no statistically significant effect on trust rating, F(4, 132) = 0.63, p = 0.68, along with condition, F(1, 132) = 3.53, p = 0.062, and the interaction between political party and condition, F(3, 132) = 2.48, p = 0.085. However, upon closer inspection, using a post hoc test, among Republican respondents, there was a statistically significant effect of condition on trust rating, t(132) = 2.94, p = 0.004 (there was no significant effect observed with Democrats or Independents). It is important to note, however, that there were far fewer Republican (31) and Independent (25) respondents than there were Democrats (65), which is why the Y-axis is proportion instead of count. This may have also impacted the robustness of the findings for Republicans and Independents when compared to Democrats.
Conclusion:
When comparing the trust ratings between male participants and female participants in the control groups and experimental groups, female participants showed higher ratings of trust when the group that they voted for won, compared to when they lost. What this represents is that the female respondents in the experiment have much more drastic changes in levels of trust when they won compared to when they lost. However, the trend was not significant in male respondents when compared to female respondents, although it was still present. This was backed by the statistically significant findings from a post hoc test, which showed a significant effect for female (but not male) respondents.
The findings related to how different political parties behaved within the conditions were of particular interest as they strongly related to the initial hypothesis of the paper. Primarily, there was a change in the trust ratings of Republican respondents between the control and experimental groups. The Republican respondents had far more trust when they won the vote, but a higher amount of distrust when they lost the vote. This is bolstered by the statistically significant findings of the post hoc test, which indicates a significant interaction between Republican respondents and condition. In contrast, Democrats and Independents did not have this statistically significant interaction. This finding may help understand the behavior of Republican voters who were at the Capitol on January 6th, protesting the results of the 2020 presidential election due to distrust of the results. However, it is important to note that due to the small sample size of Republicans within this experiment, the results can’t be generalized to reflect those of the general public.
Sources
https://b2231874.smushcdn.com/2231874/wp-content/uploads/2021/01/shutterstock_1818888026-scaled.jpg?lossy=0&strip=1&webp=1