

Research and Relevance: How have Harvard researchers’ interests shifted over time?
Background
Since the advent of home computers in the mid-80s, computational research has exploded in popularity and utility. These advancements have brought accessibility, constant diversification of topics, and increased funding amounts to computational research.
In an age where the global scientific output doubles approximately every nine years, we wondered how Harvard researchers—in STEM particularly—have contributed to the growth in research. Have trends in Harvard research output matched the nation’s trends? Where are the points of divergence and what do they indicate about Harvard? These are some of the questions that guided our research.
We at the Harvard College Open Data Project wanted to see how STEM research directions have evolved and shifted in the past three decades. Using Kevin Huang’s coding template, we obtained scraped data containing 1875 papers in the fields of physics, mathematics, and computer science, ranging from 1991 to 2020. Here is what we found.
Data & Methods
Our data was scraped from arXiv, an online open-access archive for over 1.7 million research articles, using code originally implemented by Kevin Huang. This database primarily contains information about research from physics, mathematics, computer science, quantitative biology, statistics, and economics, among others. Of these fields, our analysis is limited, in scope, to mainly physics, mathematics, and computer science—the three most prominent fields by volume.
The scraping script generated a csv file with all information regarding a paper such as its title, abstract, publication date, authors, and primary category as classified by the arXiv Category Taxonomy. First, we converted all category taxonomy symbols to their parent field (physics, mathematics, computer science, quantitative biology, or statistics).
To examine the longitudinal trends, developed a script in Python that sorted all papers by date and for each field, determined the number of papers published in each year from 1991 to 2020. To account for discrepancies among fields, we normalized the frequencies by the total quantity of published papers across all years. Based on the normalized data, we then generated a time-series line plot visualization with the frequency distribution for each research field across time. We also visualized the composition of research fields for each year as a stacked bar graph. Since physics was the most dominant research field (a result of the arXiv database) we then generated the composition graph excluding physics papers.
We conducted similar longitudinal studies for Stanford and MIT, research institutions similar to Harvard, to determine whether there were any major differences in their research trends. We generated a line plot visualization for each of the colleges.
Our Harvard results
We found that research output in physics and math fields has stayed relatively constant in the past 30 years, while computer science research has skyrocketed in the past decade. Both statistics and quantitative biology show much greater variation over time, but are relatively consistent overall, which is likely a product of their lower representation in the dataset.
Computer science appears to peak at 2001-2003, which coincides with the dot-com boom. It also demonstrates a steady upward increase in the years following 2010. This apparent change is much more significant than any of the other fields. Meanwhile there is little evidence of any downward trend in research, which is consistent with the trend of research output increasing exponentially through time.
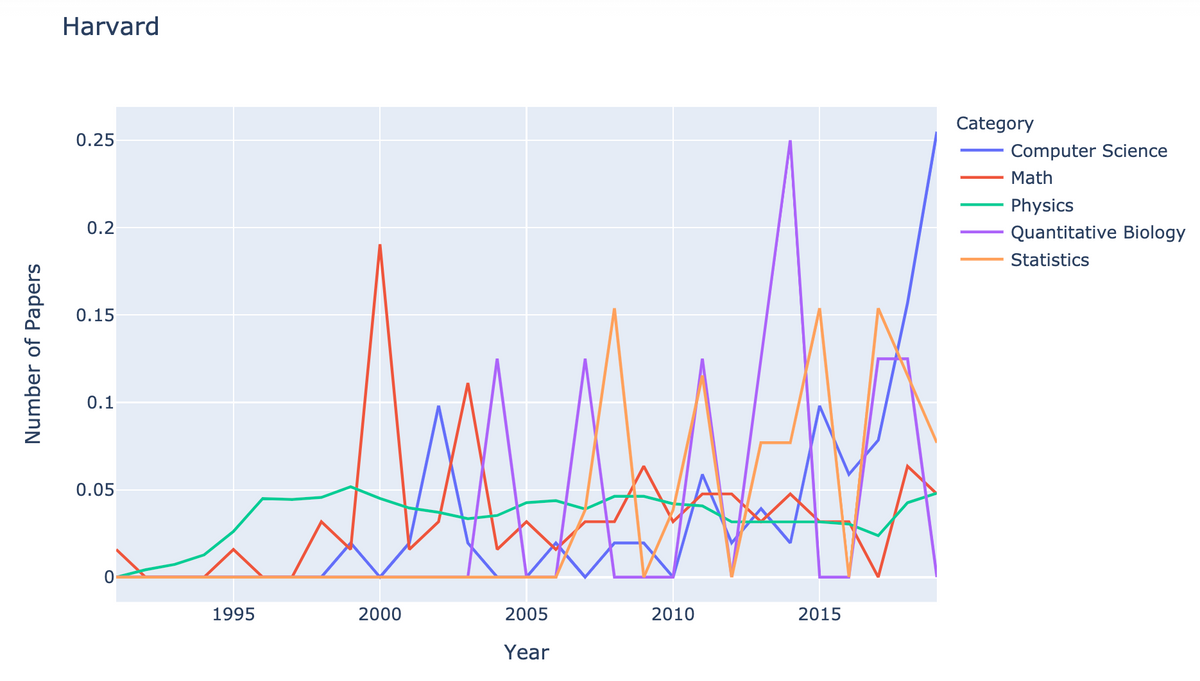 Normalized Frequency of Harvard Research Papers by Year
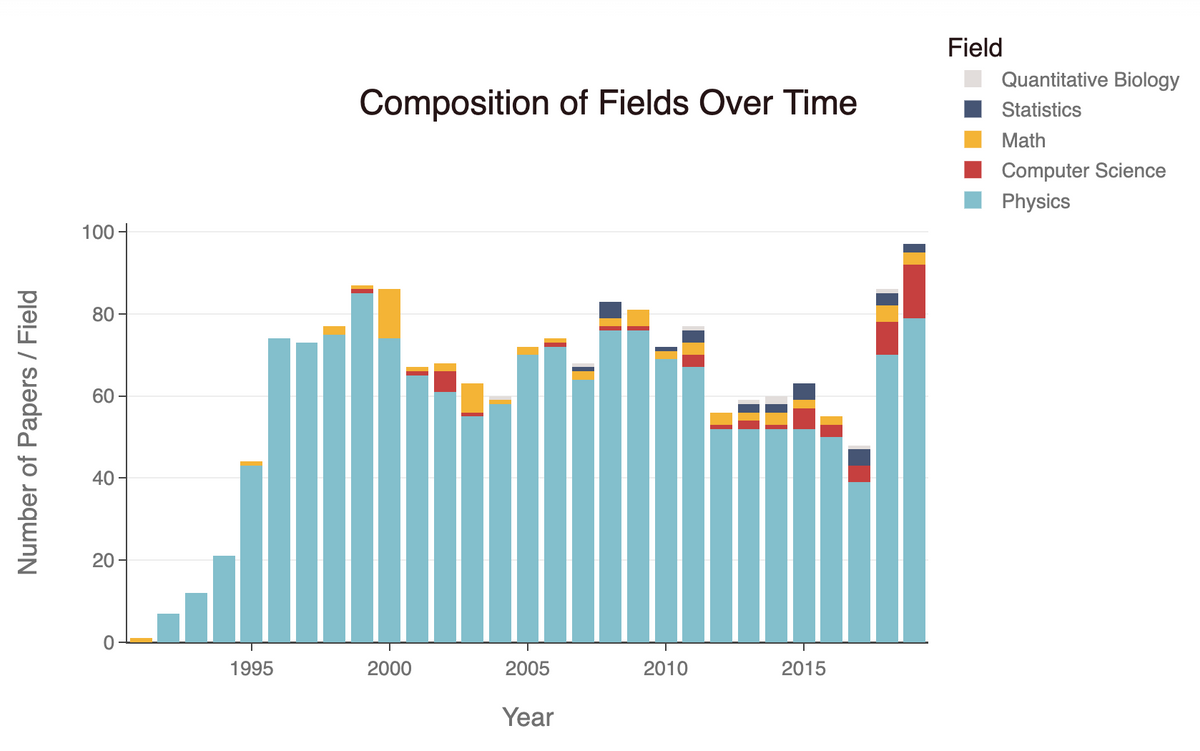 The Relative Proportion of Publications That Fall Into Each Field of Harvard Research
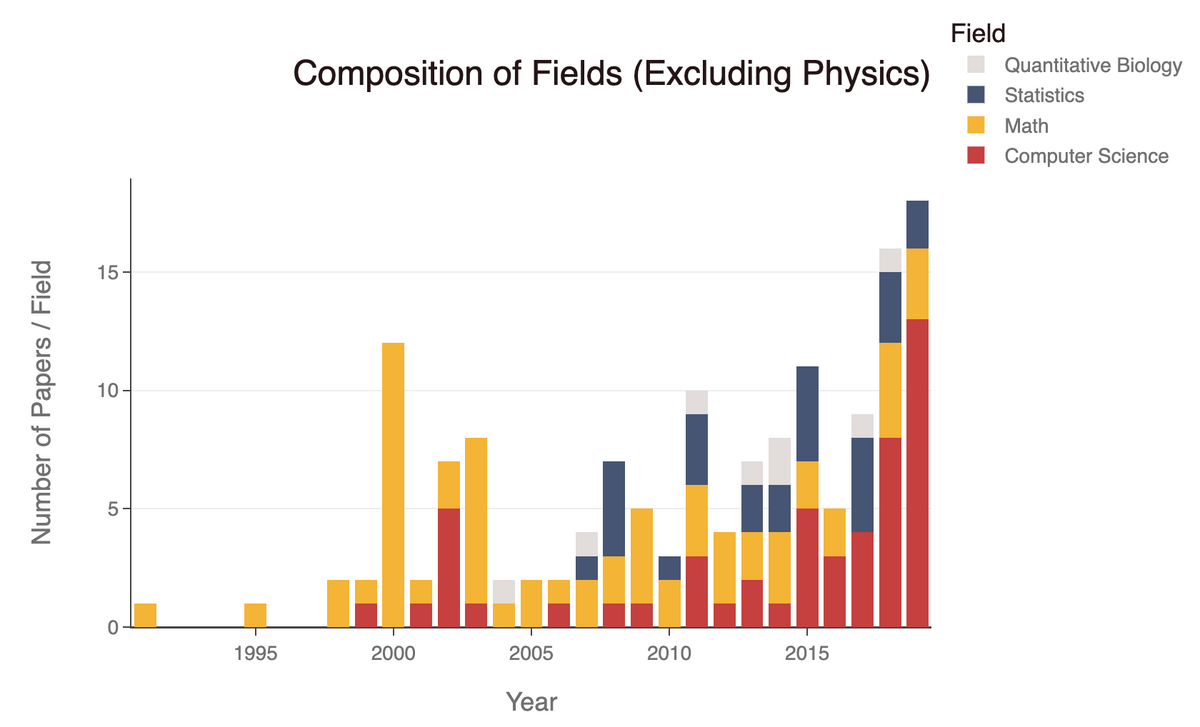 Composition of Fields with the Outlier of Physics Removed More Easily Shows Trends
We also examined the distribution of the number of papers published to the arXiv database in each year from 1991 to 2020. One small note is that the 2020 data point is not completely representative of the final number of publications for 2020, as we have not yet completed the calendar year.
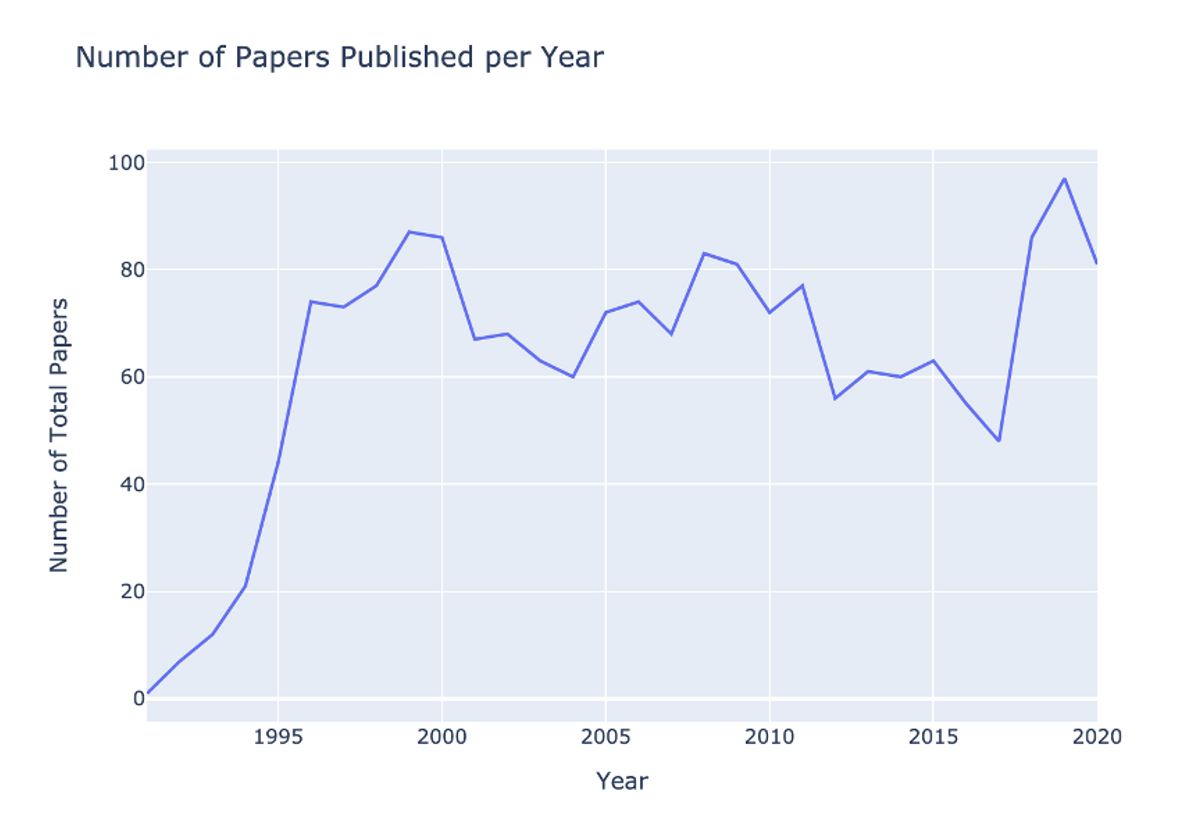 Overall Trend in Research Quantity at Harvard
Although the number of research papers published year nationwide has been steadily increasing, based on this graph, we can see that Harvard trends have not paralleled that of the nation at large, at least in regards to publishing on ArXiv. Though the number of publications have risen sharply in the last two or three years, the general trend is mostly constant, with the mean number of papers published in the last thirty years being 62.47 papers per year.
Comparison to Stanford and MIT
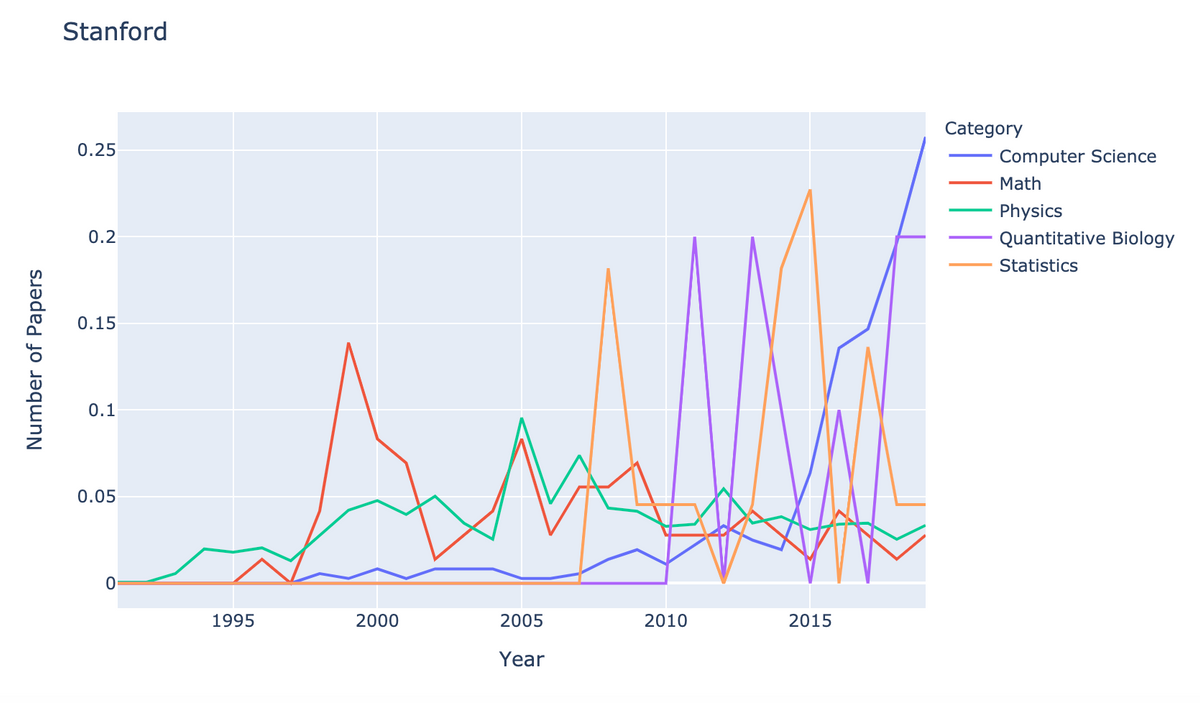
Using a similar process, we scraped data for Stanford researchers from the arXiv database and plotted the research patterns for Stanford—a similar research institution. Most fields of research displayed similar patterns of growth or decline. For example, in both Stanford and Harvard plots, we can see that computer science research began to increase rapidly in the late 2000s and climbed to dominate the research scene in recent years. Both schools publish about the same number of physics papers per year and both schools have seen a decline in the number of mathematics research papers in the last decade.
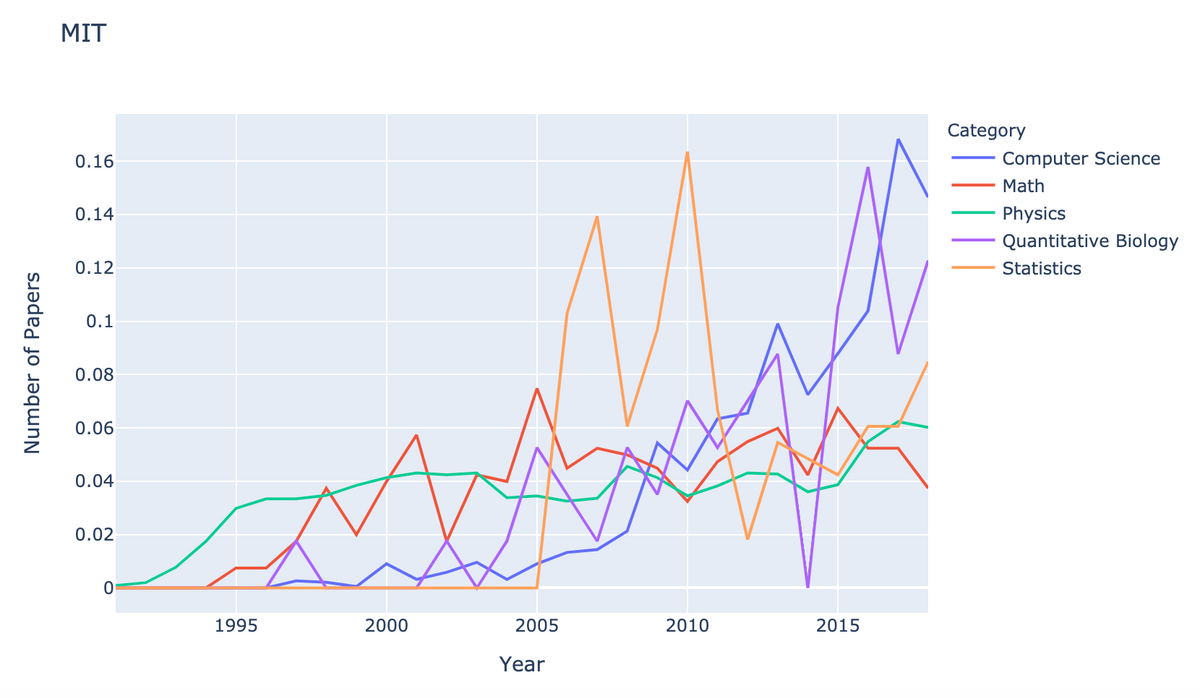
Likewise, MIT shows increases in computer science and quantitative biology research in the same time period (late 2000s to present). However, the data from MIT also shows slight increases in math, statistics, and physics, which slightly differs from Harvard and Stanford’s trends.
Discussion of Data and Results
We also considered the following potential flaws within the data scraped from ArXiv.
First, physics research papers are strongly overrepresented in our sample, comprising over half of the papers from ArXiv (approximately 1600 research papers), while categories like AI had as little as three papers in them. The physics time-series graph (green line, see above) has a much steadier and constant trend consistent with it’s larger sample size. Mathematics shares this quality to a lesser degree, while Quantitative Biology shows a much more sporadic trend. Furthermore, there are only three AI category papers in the past 20 years. These differences in relative quantity across fields definitely impacted our results, and acquiring more diverse data (e.g. not so concentrated in physics) or more data for non-physics categories would improve the rigor of our analysis.
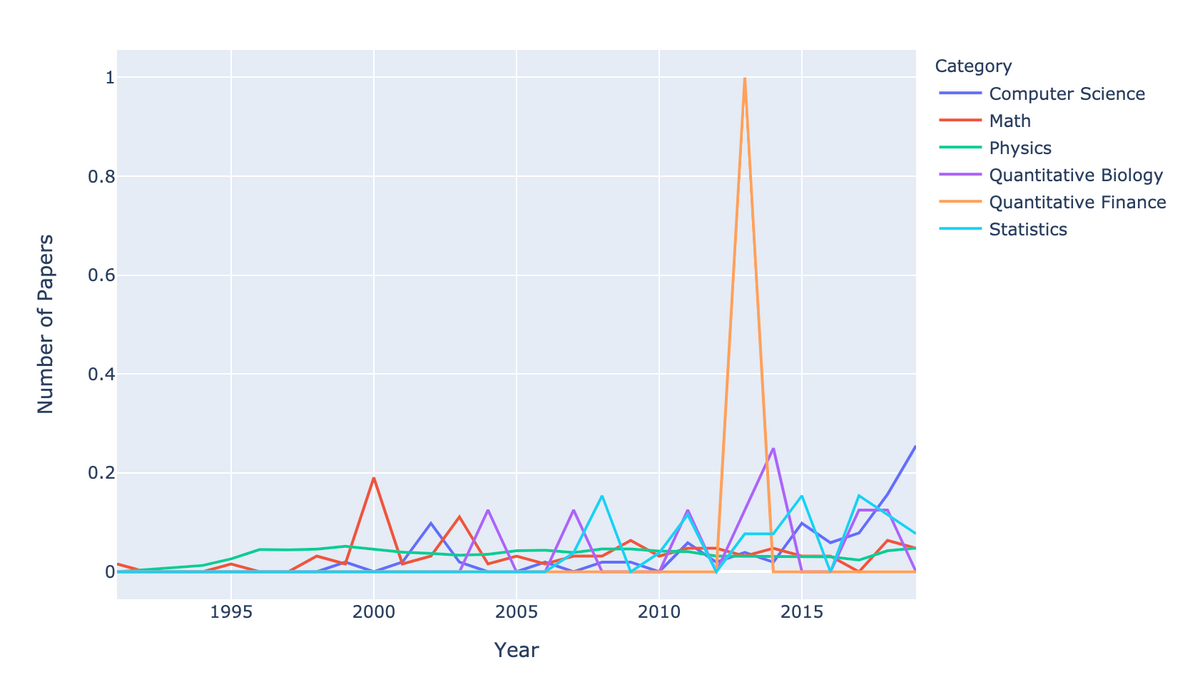
Another curious result is that, when looking at the dataset including the quantitative finance category, there was a large spike in 2013 (see the orange spike below). One shortfall of our data set was that there were only two quantitative finance papers in the entire 1800+ element dataset. Both papers happened to be published in 2013, so the 100% concentration of papers in 2013 resulted in a misleading visualization.
We would also like to note that our sample size represents only a portion of the true number of Harvard papers published. According to the Nature Index, Harvard University affiliates published 210 articles in just two science magazines—Nature magazine and Science magazine—in 2018 alone. This number doesn’t even begin to cover areas like quantitative finance or economics. The average of 62.47 papers/year from the arXiv database is merely only a small subset of the overall research published by Harvard affiliates. In the future, we could correct this by scraping data from more holistic publication sources (such as Scopus or PubMed).
Still, even by analyzing a sample of the larger portion of Harvard-published research work, we can glean valuable visualization results and insights regarding the evolving directions of research within the Harvard academic community. Ultimately, this can provide the foundation for analyses that could be conducted across larger datasets and more universities.
Given the data and analysis, we were left curious with more interesting questions to explore. For example, beyond Harvard, Stanford, and MIT, what are the overall trends across all US universities? Furthermore, how have research fields within the humanities and social sciences evolved throughout the years? Examining questions like these would provide more insight into overall research trends over time.
Final thoughts
- Research output has increased as a whole throughout the last three decades at Harvard.
- Harvard, Stanford, and MIT show comparable results in terms of growth rates in the five main fields: physics, mathematics, computer science, quantitative biology, and statistics.
- Computer Science (and computational research in general) remains the fastest growing area of research across all three universities examined.
- Published research papers on ArXiv are heavily skewed towards physics research, both when examining Harvard, Stanford, and MIT affiliates.
- Future analyses could look into more online publication databases other than ArXiv, such as scraping Google Scholar to get a more holistic view of research trends.