

Predicting the 2020 Straus Cup Champion
Sans pandemic, who would have claimed the trophy?
Introduction
One of the many things we missed out on during the Spring was the conclusion of the intramural season. Here is what the rankings looked like when we left campus:
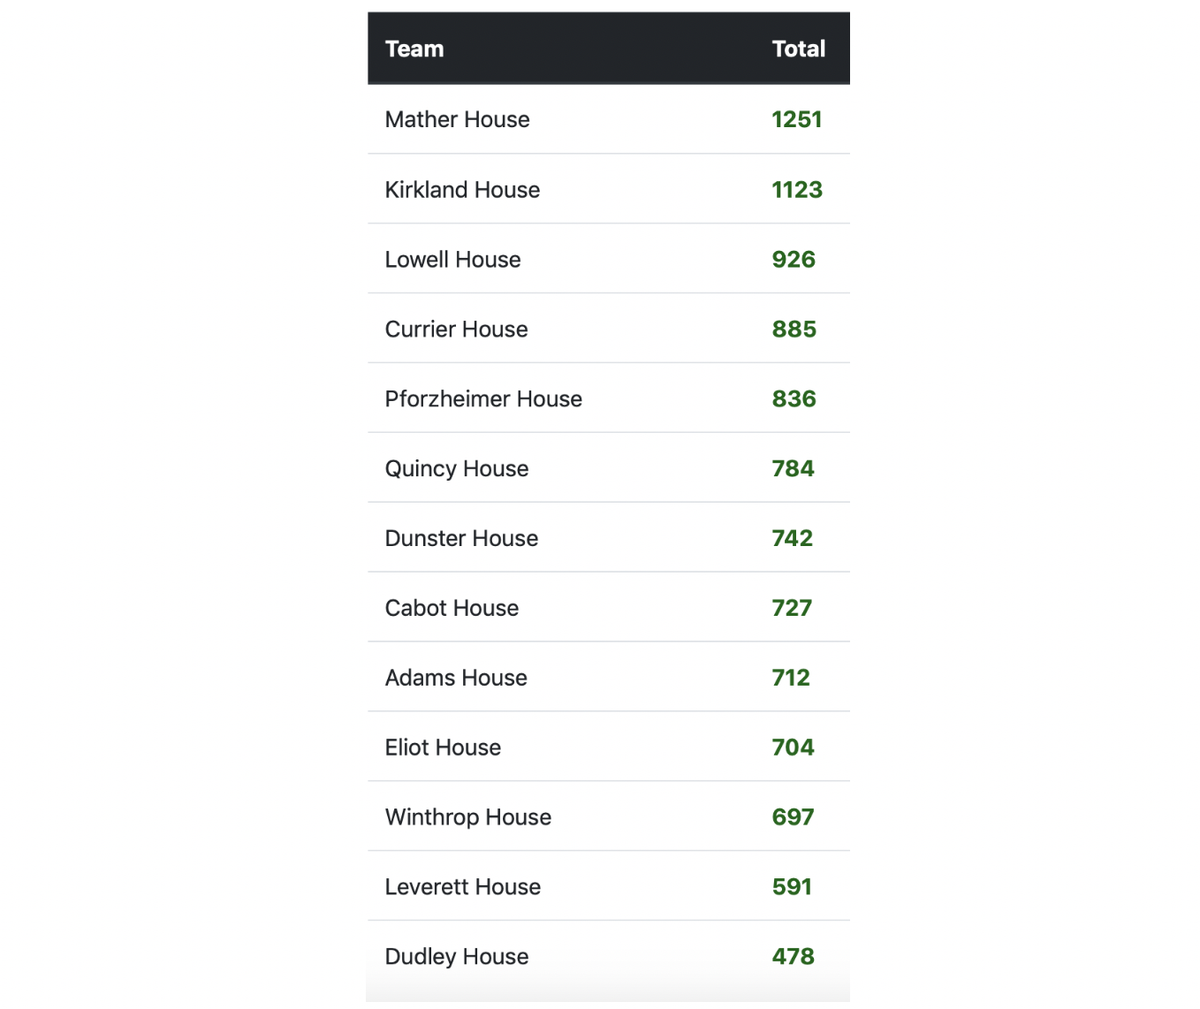
Mather was in the lead, and was therefore awarded the coveted Straus Cup for the second year in a row. But what would have happened if we had been able to play out the spring? Would Mather have held on? Could Kirkland, Currier or Lowell stage a comeback?
The Data
To tackle the problem, I started examining IM data from past years. Thanks to the current leaders of the intramural referees, and through the current IM website, I got access to the points awarded from every sport during every season, ranging from the fall of 2012 to the winter of 2020. From 2012 to 2018, the data was given directly to me in the form of Google Sheets, and for 2018 onward I copied the data from the IM website.
Taking a first glance at the data, some complicating factors jump out. First, the scoring systems for sports vary greatly from sport to sport. In addition, the rules have changed for how certain sports are scored over time, making cross year comparison more difficult. Secondly, which sports are played changes annually: for example, broomball replaced hockey starting in 2016–2017, and badminton was not played during the 2016–2017 or 2017–2018 seasons.
Understanding the rules of how IMs are scored is vital to understanding the IM data. Broadly, there are four categories of ways to score points for IMs:
- Sports played for wins and losses
- Tournaments or one shots
- Participation
- Other
Sports played for wins and losses are sports like soccer, basketball, and tennis. Tournaments or one shots are sports like spike ball, climbing, and crew that are only played once. Also included in this category are soccer, frisbee, and flag football in the spring.
Participation currently includes B volleyball (since 2018–2019), Harvard on the Move, and River Run (literally running, not the pre-housing day tradition). While there are some points allotted for placing, the vast majority are based on participation. For volleyball, there are two “versions” of the sport that are played: A, which is generally more competitive, and B, which tends to be people playing for fun. Harvard on the Move and River Run are both runs, scored on participation; River Run happens twice a year, and Harvard on the Move happens weekly. Finally, points in the other category are things like meeting attendance. Going forward, I will refer to the first three categories as the event categories.
First Impressions
To predict the winner of the Straus Cup for the 2019–2020 season, I started with examining approximately how much information we lost out on from spring 2020. On average, from 2012–2013 through 2018–2019, houses earned 45.77% of their points in the spring, the largest percentage. Fall makes up 33.99%, and winter makes up only 20.26% of the points earned. This effect seems to be driven by the number of sports in each season; in general, there are fewer sports in the winter, and there are often more tournaments or one shots in the spring than fall meaning more points are up for grabs.
A second natural question to ask is to see if houses that do better in the standings pick up more of their points during the spring, or fewer. To measure this, examine the average percentage of points earned in the spring by rank, average from the 2012–2013 through 2018–2019 years:
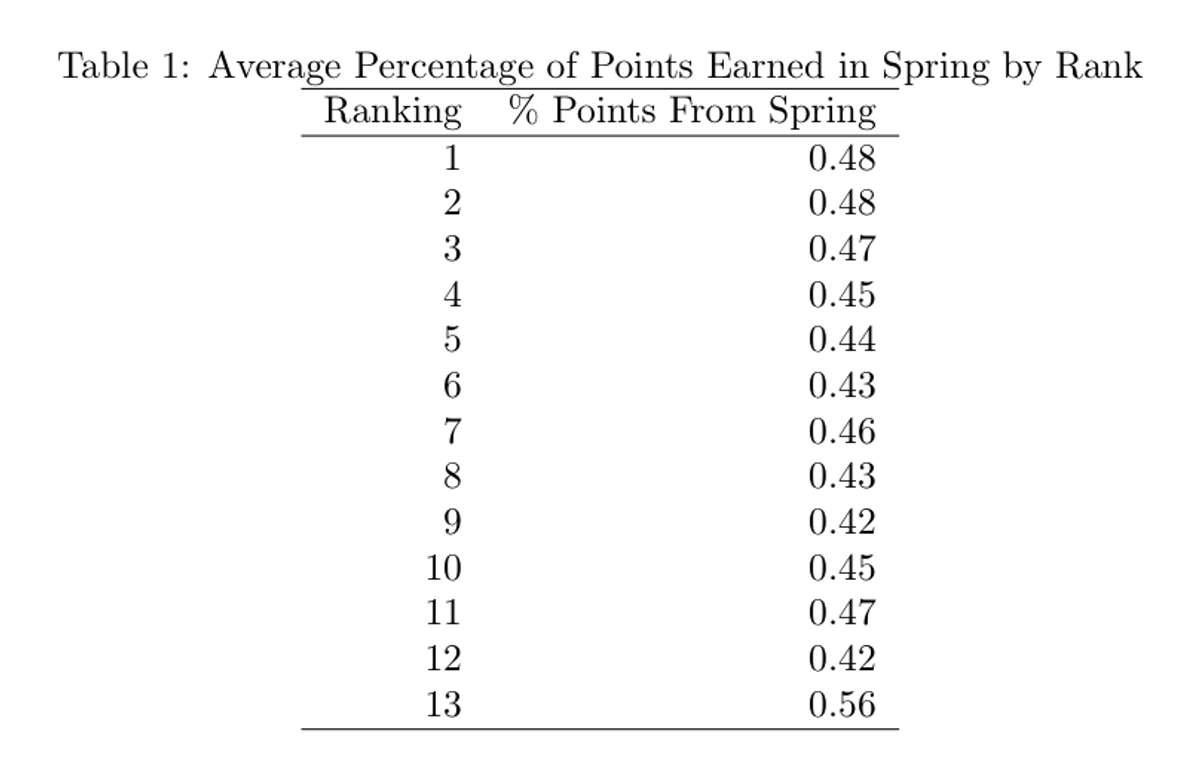
This table shows the average percentage of points by final ranking in the Straus Cup standings. The only outlier is that houses that finish last have a larger proportion of points from the spring on average, but otherwise, the percentages are relatively consistent across rankings.
One other baseline to look at is breaking down scoring by category. One could hypothesize that Straus Cup winners dominate the tournaments and one shots, while only being above average for events played for wins and losses, because people are more willing to show up to one time events. To examine this possibility, I converted the raw point totals into z-scores, by year and sport. For example, the distribution of fall soccer points in 2015–2016 was rescaled to have mean 0 and standard deviation 1, in order to make comparison easier. Sports are scored differently in each category, and have very different variances, so standardizing the data makes it easier to compare and interpret. First, I averaged the z-scores across categories, and then across rankings as before.

Secondly, there is some clustering: the top two houses tend to be significantly better than the rest of the field across every event category. After the top two, there is a gradual decline, and then a steep drop to last place.
Data Cleaning
Before we continue, I need to make three notes on the scoring systems and related data cleaning. It used to be that A, B, and C basketball were scored independently, until the 2014–2015 year. However, since then, only the positive points for the largest two divisions were counted, but negative points from forfeits are counted from all three divisions. I know this sounds confusing, which is why I combined all the points from basketball, both positive and negative, into one scoring category called “totalBB.” While this may not be an actual scoring category, it captures more information and is easier to understand when being used in regressions.
Second, because the scoring systems changed across years, there needs to be some adjustment of the raw scores. To do this, I subtracted the mean point value of each sport, by year (i.e., the mean of flag football in 2014–2015 was normalized to 0). There are three reasons for this: it standardizes the data across overall scoring systems, preserves variation in scoring among sports, and makes it easier to account for missing data. I wanted the regression to take into account that some sports could have more value than others, because there could be value in excelling in particular sports. For example, it could be that performance in soccer is indicative of having better athletes, which would give an advantage throughout the year.
Missing data turns out to be an issue because of how often sports rotate in and out of being played. Roughly a third of the sports played in the 2019–2020 fall and winter have not been played every year in the dataset. To remedy this, I set those missing to values to 0; because the mean of each sport is normalized to 0, this means that for years where a sport was not played, every house is given the score of being exactly average.
Regressions
Now, we come to the exciting part: predicting the Straus Cup winner from this past year. There are many ways to approach this problem, but I decided on a relatively straightforward method: linear regression.
Regression #1
We begin with a simple regression: let’s examine how well the rankings after the winter season (based on points in the fall and winter) predict the full year rankings. Then, we use the regression to predict the 2019–2020 results.
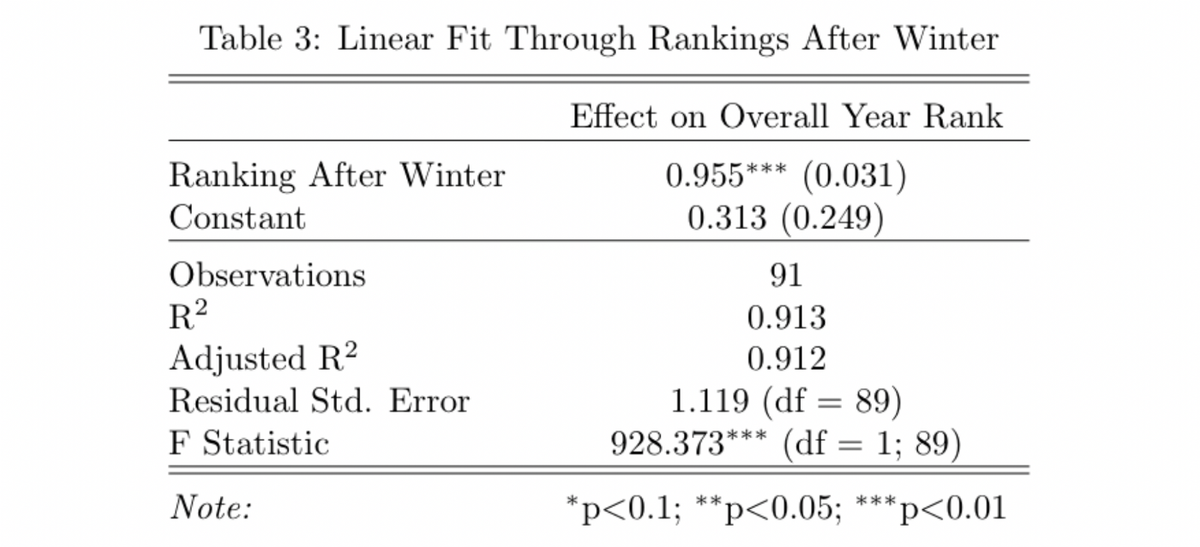
There are a few important features to note about this regression: first, a line fits the data quite well, and secondly, the coefficient on the ranking after winter is positive and statistically significant. The goodness of fit by the line is demonstrated by the R squared of 0.913, which indicates that 91.3% of the variance in the data is accounted for by the rank after winter. Secondly, the coefficient on rank after winter is positive and close to one, meaning that there is close to one to one correlation between ranking after winter and the final rankings. This result fits with the basic hypothesis that houses that do better in the fall and winter can carry forward that performance in the spring.
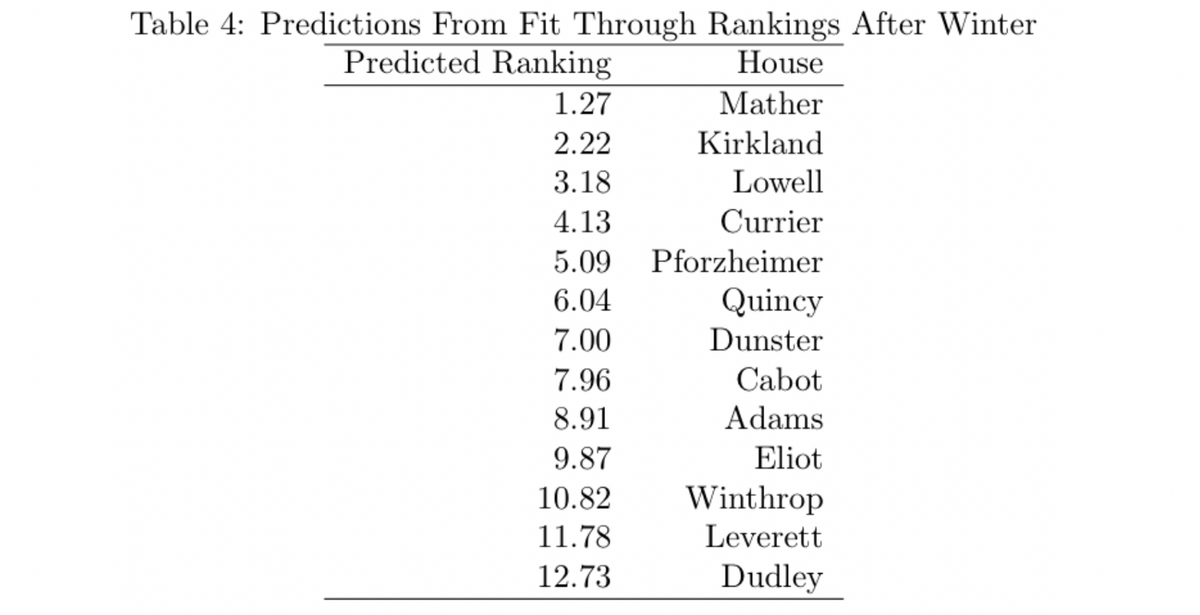
The predicted rankings are not whole numbers, but we can still compare the relative ranks to crown a theoretical champion.
Regression #2
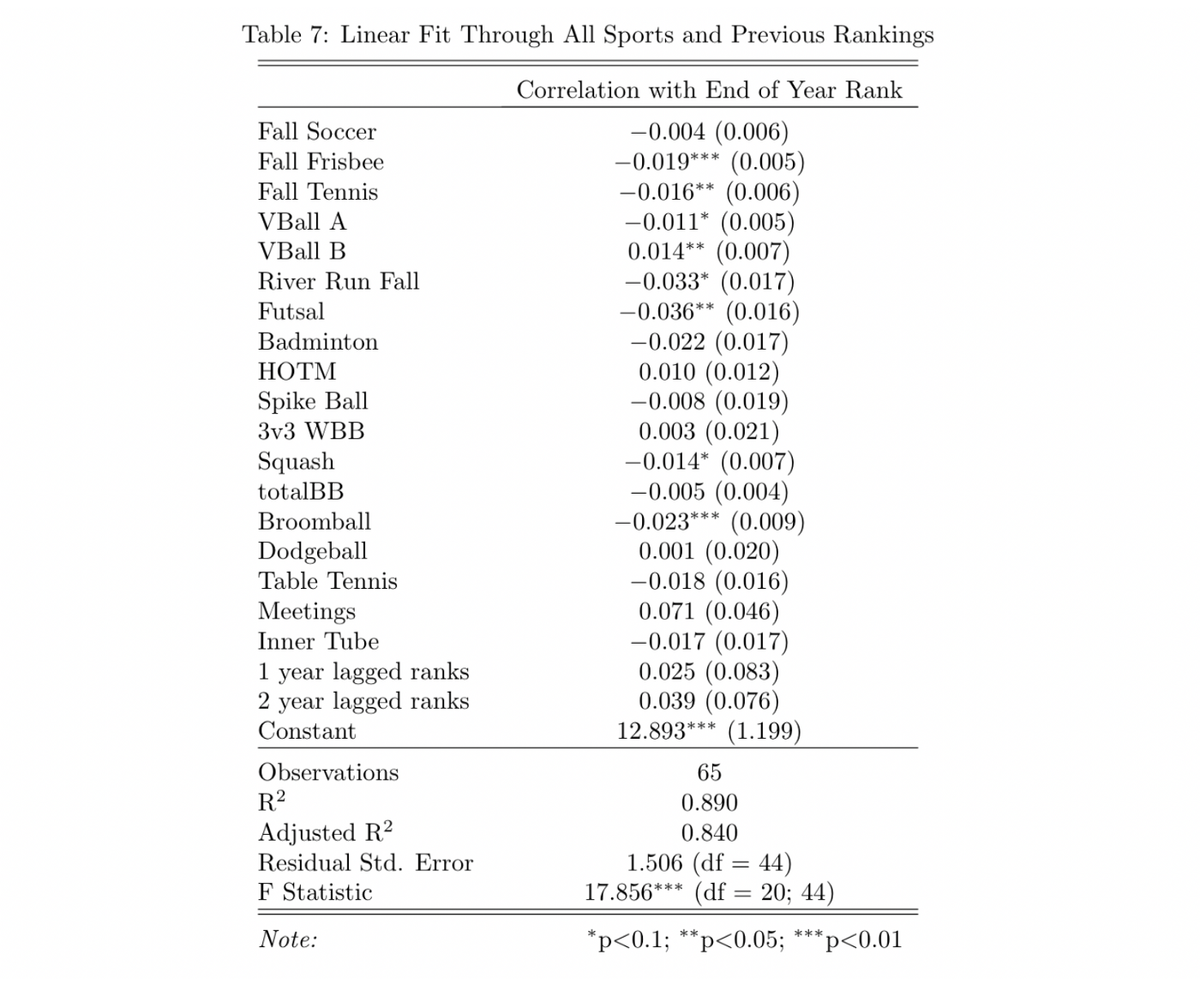
A second, and slightly more sophisticated, approach to the linear regression model is to calculate a regression of the end of year rank on all of the sports that were played in the fall and winter of the 2019–2020 year.
Two things jump out immediately: the magnitude of the coefficients and the relatively small number of statistically significant coefficients. The small magnitudes (outside of the intercept), makes sense intuitively: racking up a huge number of points in soccer can only help your ranking so much, because soccer is only one of many sports. Second, most of the coefficients are not statistically significant, and because of the small magnitudes, saying they have an effect on the rankings may not be true.
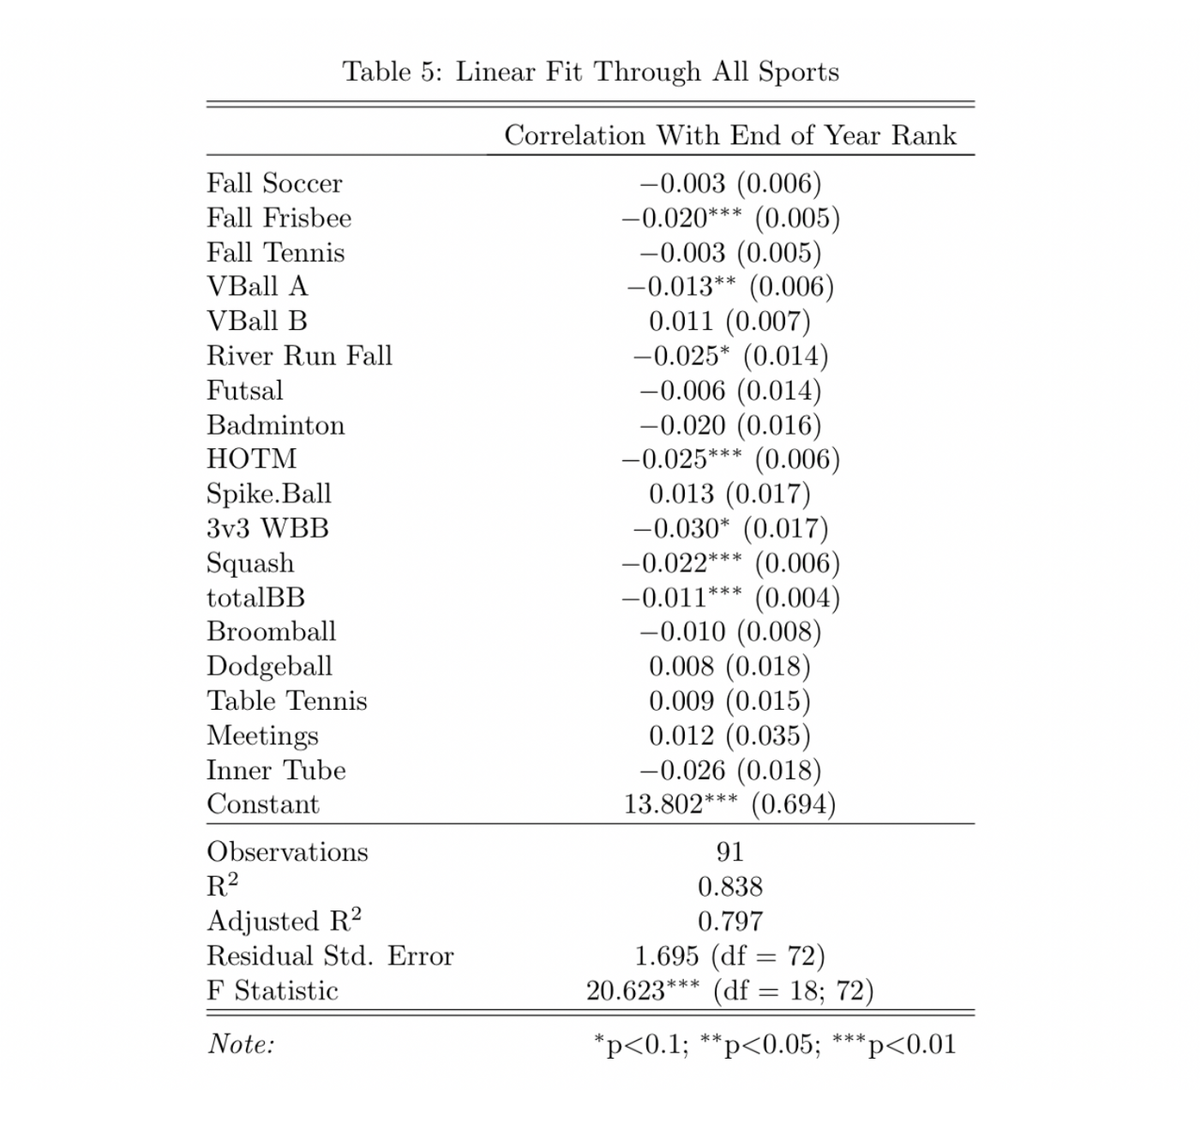
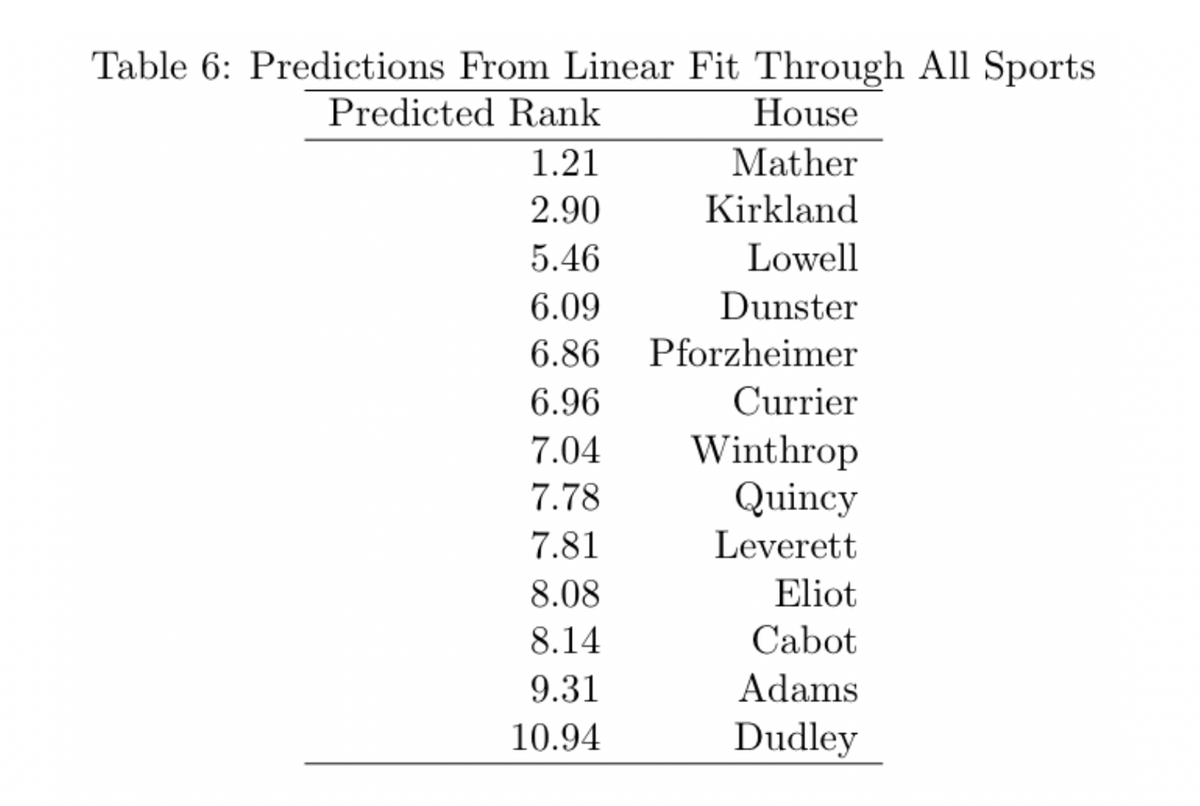
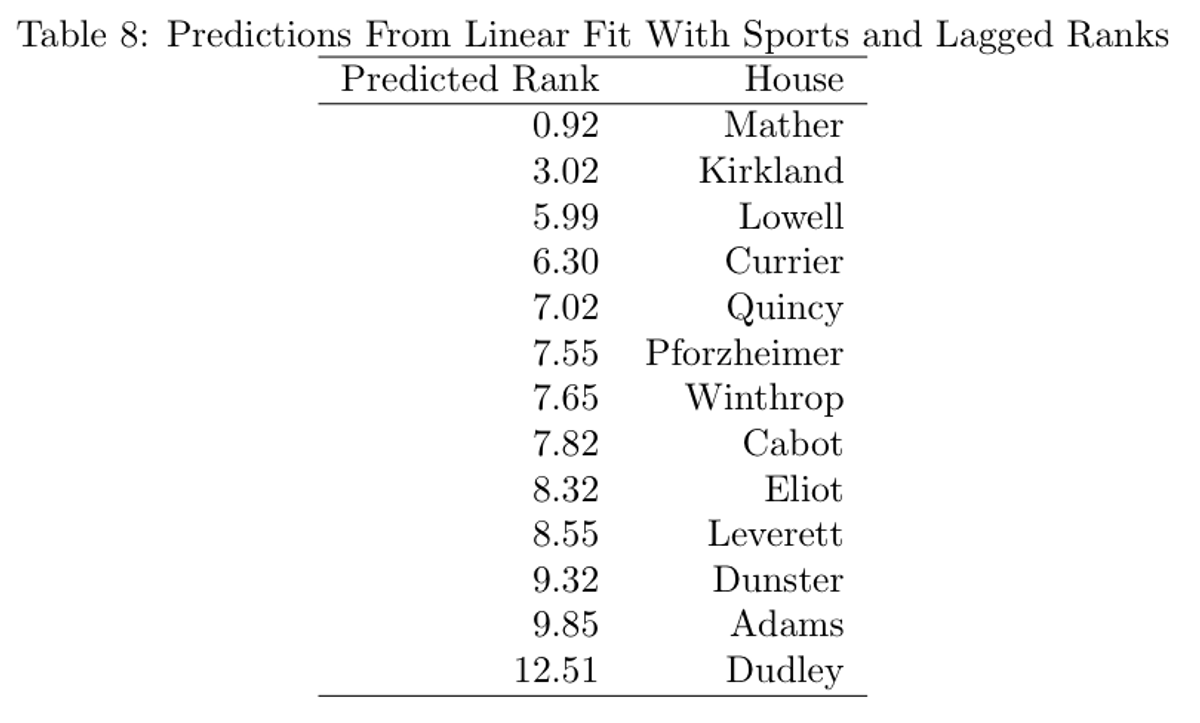
Negative coefficients make intuitive sense: as you score more points, your ranking goes down, which is the goal. That means that any positive coefficients, like for B volleyball and spike ball, suggest that doing well at those sports actually hurts your chances of winning the Straus Cup. Given that none of the positive coefficients are statistically significant, it’s hard to take the correlation seriously, but the idea is amusing nonetheless. Despite the strange results, let’s examine the predicted rankings from this year:
Again, Mather is predicted to come out on top, with Kirkland in second place. This regression has Kirkland slightly farther behind than the first one. Winthrop has the largest improvement, by almost 4 spots, and Adams has the worst drop off ordinally though the predicted rank stays relatively close (8.91 vs 9.31).
Confounding Factors
It’s important to remember that the points from just the scores themselves may not contain all the relevant information, and there could be confounding factors that systematically skew the results. Across years, there could be house effects, meaning that certain houses consistently over or underperform their predictions. Within a year, it could be that a particular class is extremely athletic or enthusiastic in one particular house, so they carry that house to victory. To look for house effects, I began by plotting the residuals, meaning the actual rank minus the predicted rank, differentiated by house.
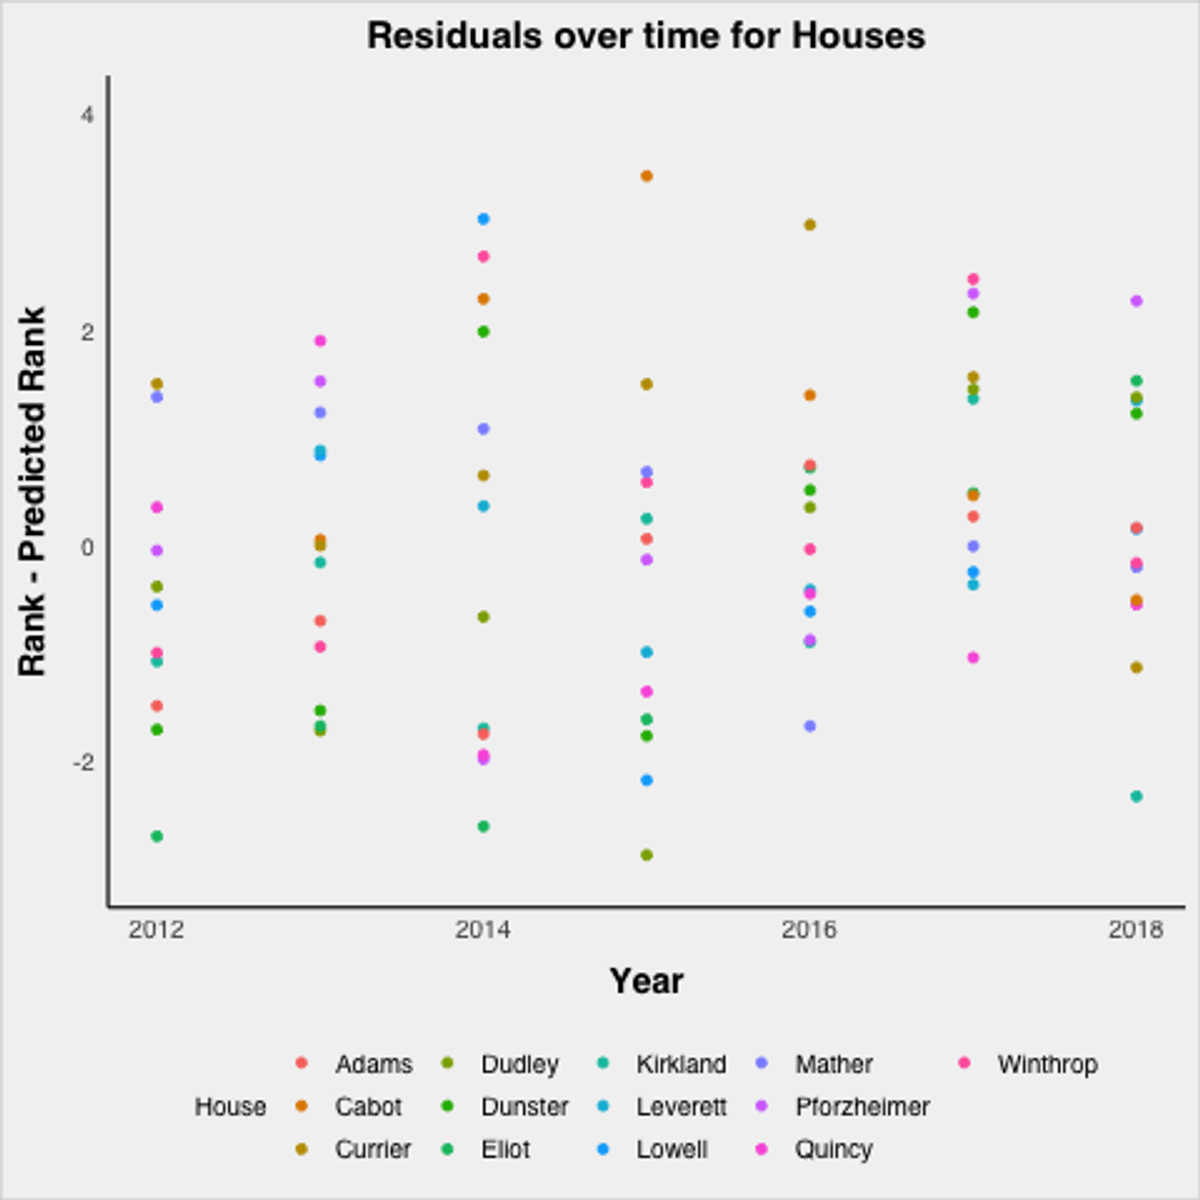
This graph is noisy, and it is hard to see consistent trends, which is actually a good thing as it suggests there are no consistent house effects. Take a closer look at the top ranked houses from the 2019–2020 season:
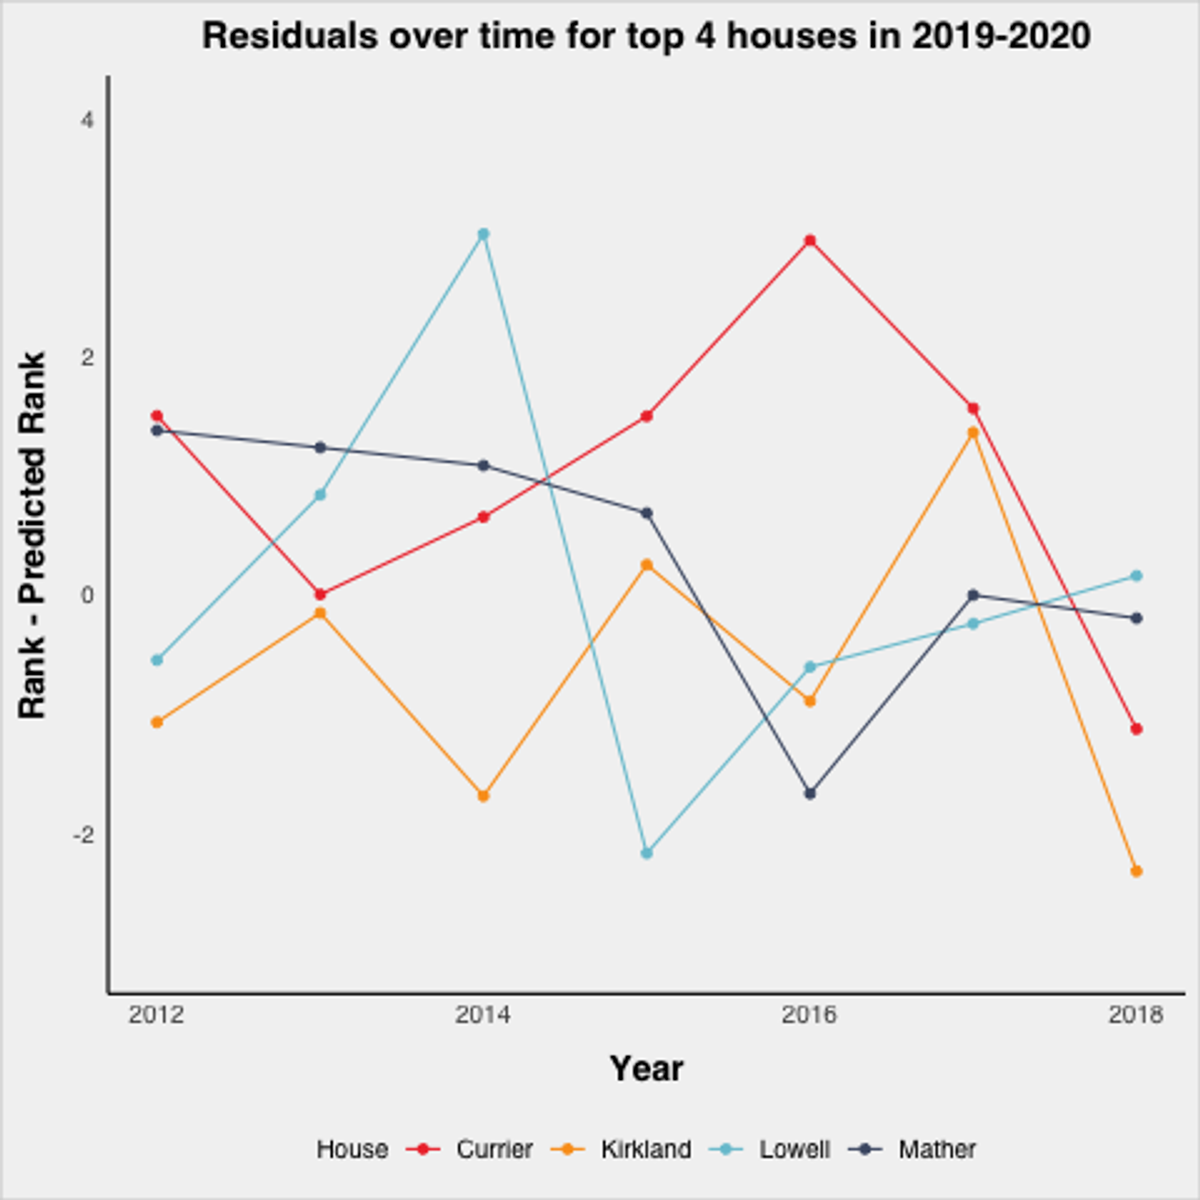
Again, no consistent patterns. All four bounce around, meaning that it is hard to say there are consistent house effects. Based on that, it’s hard to draw strong support for including house effects as a control in the regression.
Next, to address having a particularly enthusiastic or athletic class, I incorporated the rankings from the previous two years into the left hand side of the regression.
Regression #3
Similar to Regression #2, the coefficients are relatively small, and there are relatively few statistically significant coefficients, meaning that it is hard to take this regression particularly seriously. Still, examining the coefficients on the previous years’ rankings yields some interesting hypotheses (though the hypotheses themselves have no evidence from this data). The coefficient on rankings from one year prior is negative, suggesting a small positive correlation between previous years ranking and the current ranking. This impact could be the athletic ability or enthusiasm carryover from year to year. Ranking from two years prior has a much stronger negative impact, which could indicate some sort of return to the middle of the pack. However, neither is statistically significant at any level, meaning that it is hard to take either impact particularly seriously. Finally, look at the new rankings generated by this regression, mostly for fun:
Again, Mather is predicted to take the top spot over Kirkland, this time by a slightly larger margin. Given that the Mather was the defending Straus Cup holder, and came in second two years ago, this result is not particularly surprising.
Prediction Intervals
One final piece of evaluating these regression models is to look at the prediction intervals for the predicted standings. Prediction intervals are similar to confidence intervals, but are meant for single point estimates like the predicted values from a regression. These prediction intervals give a 95% interval for the range of the predictions, similar to a confidence interval.
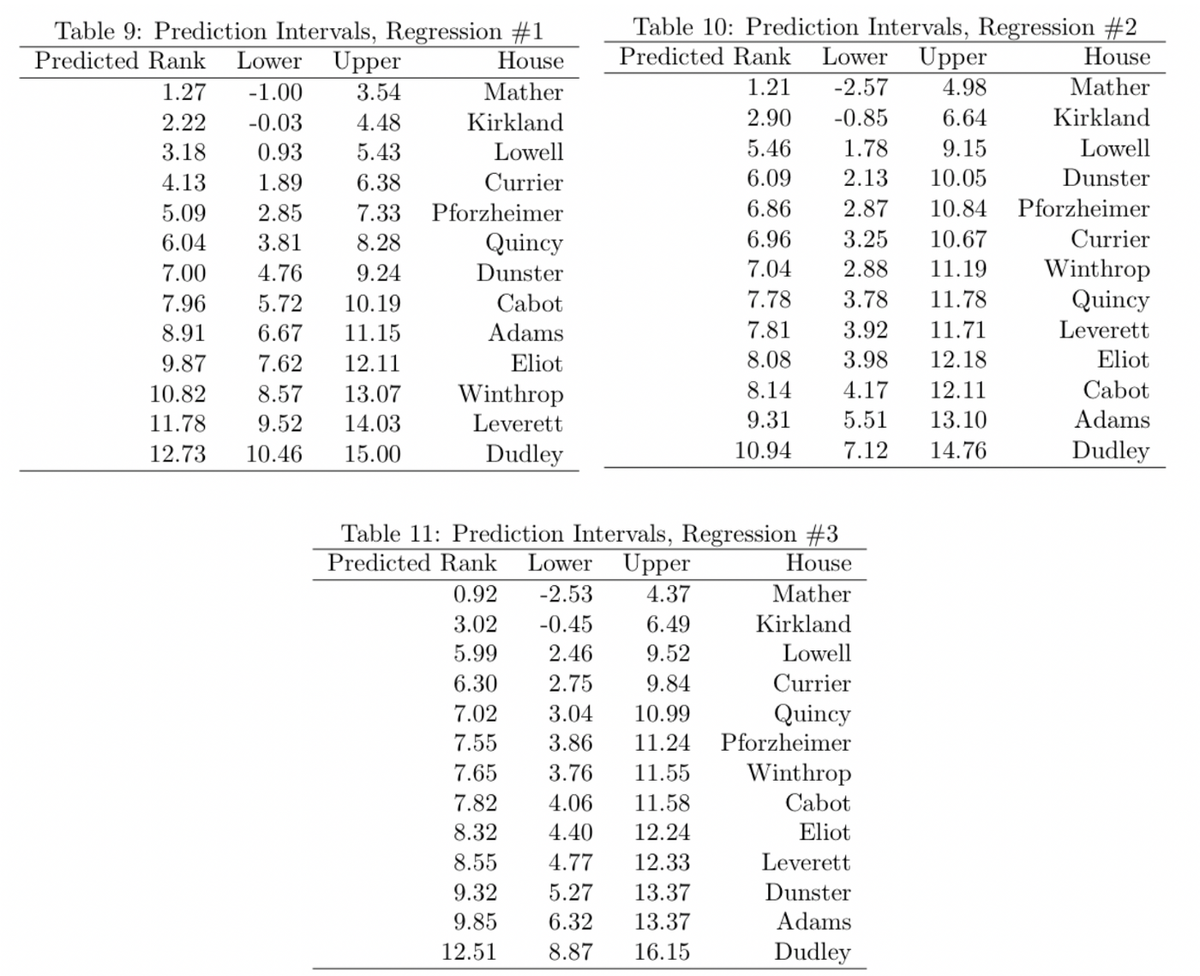
In all three cases, the intervals overlap by a substantial degree, showing the weakness of these regression models.
Further Questions
There are still many interesting questions to explore in the area of IM sports that could yield interesting follow ups or extensions to this article. One extension would be to try to come up with predictions that have more promise using more sophisticated methods. One definite possibility could be K nearest neighbors regression, given the relatively limited data. There are also probability questions to explore, like figuring out the probability that Mather actually ends up ahead of Kirkland based on the regression (or other methods) predictions.
There are also other interesting questions related to the enthusiasm question raised earlier. Do houses that perform well early in the fall inspire more participation, improving year long performance? Are there correlations between certain sports and houses (due to distance from fields or courts)? Can we isolate the impact of a particular class of students in a house?
Conclusion
After all that, it seems that confidently predicting the winner of the Straus Cup will take some more effort, meaning that for now, we have to be content with the results from the partial year and from our preliminary regressions. Congratulations to Mather on the back to back Straus Cup victories!