
Opportunity at Harvard
How do Harvard's economic opportunities stack up against other schools?
Introduction
Following the exposure of a multimillion-dollar college admissions scandal last year, the largest ever prosecuted by the Department of Justice, much attention has turned to the role of money in college admissions, particularly at elite universities. While the criminal practices of those involved in the bribery scheme may be shocking, the extent to which wealth buys admissions to such elite universities is less so. Data from Opportunity Insights, a research team at Harvard led by Professor Raj Chetty, provides a comprehensive perspective on opportunity at Harvard, both in terms of which students the university admits and how those students fare.
Using data on college students throughout the nation during the early 2000’s, Chetty’s team tracked college graduates into their 30s, providing a glimpse at the earnings of students graduating from each school.
Opportunity Analysis
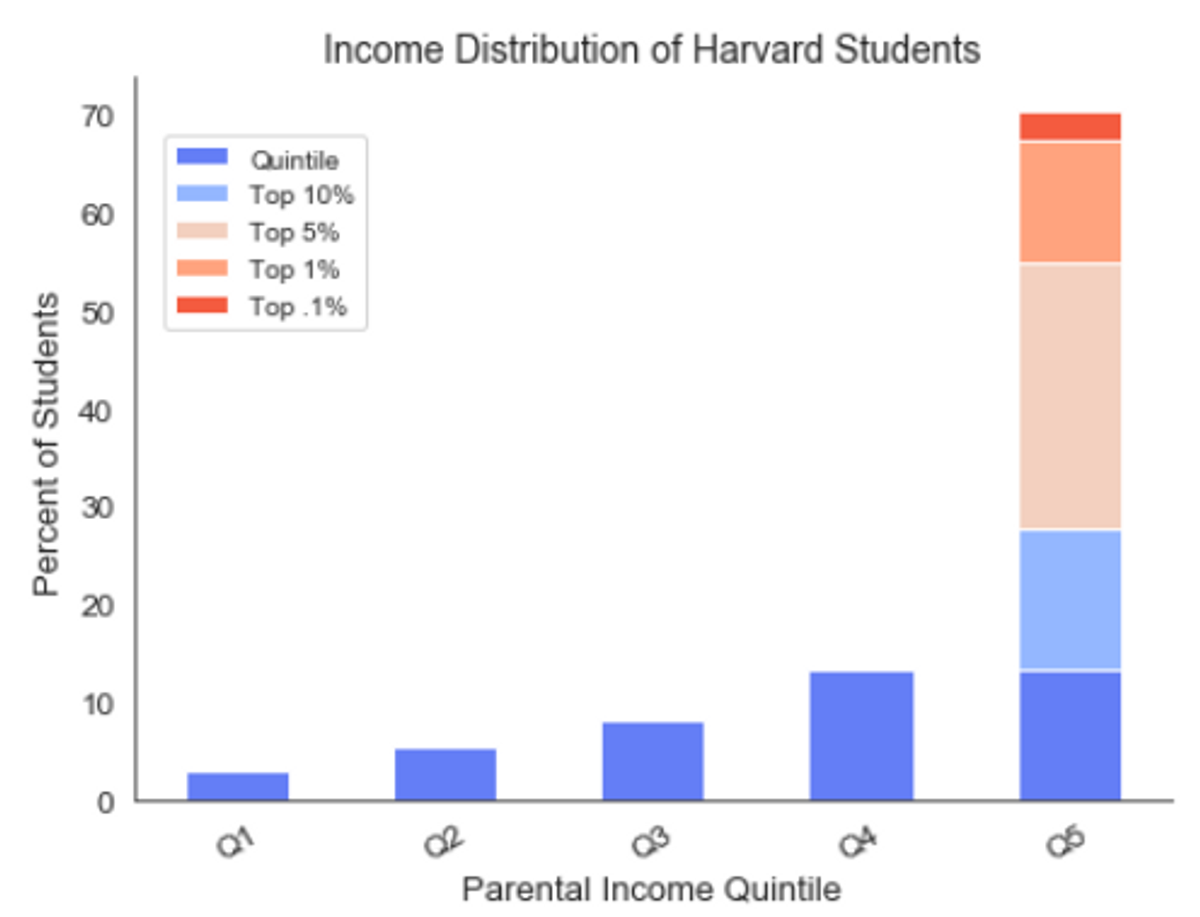
Unsurprisingly, the income of the families Harvard students grow up in are concentrated near the top. Only 3.05 percent of sampled Harvard students came from families in the bottom quintile — i.e., the bottom 20% of the U.S. income distribution. That number barely tops the percent of students coming from the highest 0.1 percent of earnings — 2.95. Similarly, 16.5 percent of students came from the bottom three quintiles while over 12 percent come from the top percent alone.
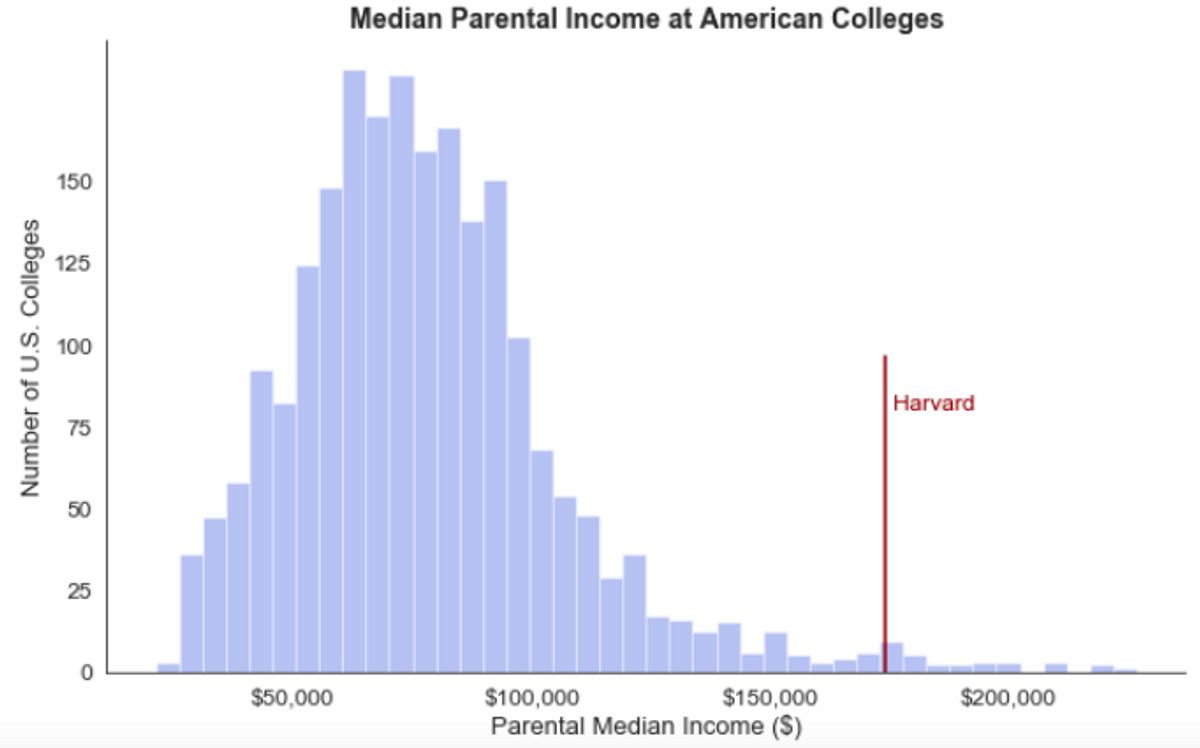
The mean parental income stands out just as much. In the years sampled, 1999 to 2013, the average Harvard student’s parents earned over $500,000 while the average across American colleges was just $107,433. The median parental income was $174,000, significantly higher than the average median income, $77,800.
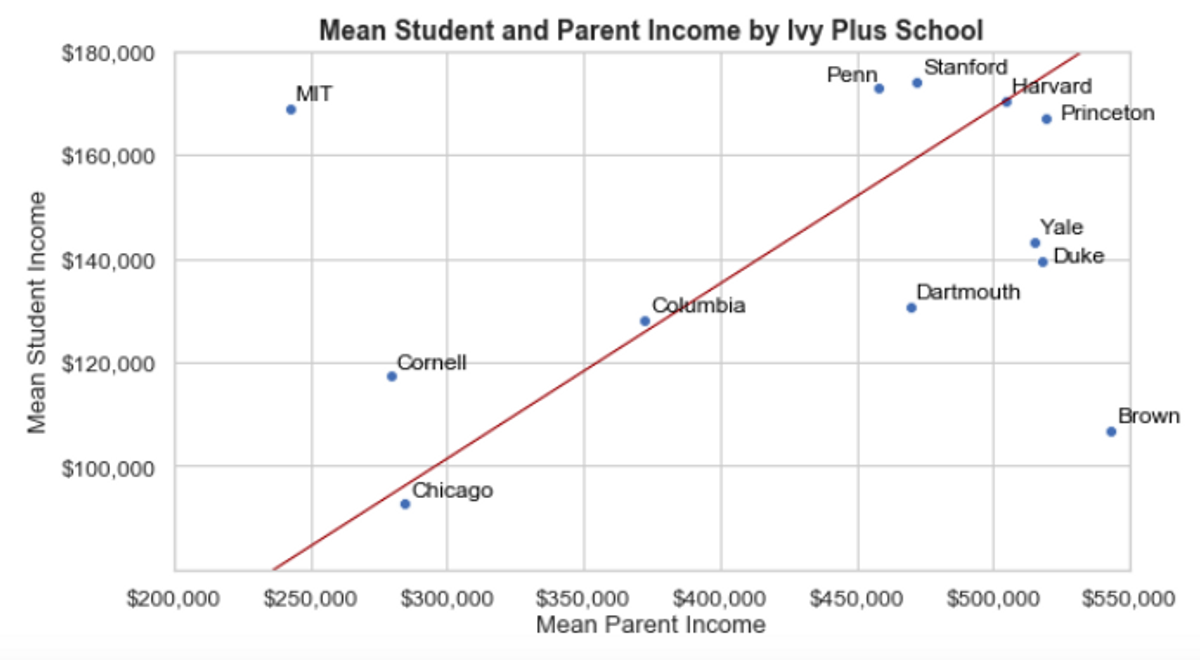
The good news for Harvard students is that they tend to earn a lot, even by Ivy League standards. Among “Ivy Plus” schools — the category set by Opportunity Insights which includes Ivy schools as well as MIT, Duke, Stanford, and University of Chicago — the average income among graduates in the sample studied was only higher at Penn, MIT, and Stanford. The line in the graph below corresponds to Harvard’s student/parent earnings ratio.
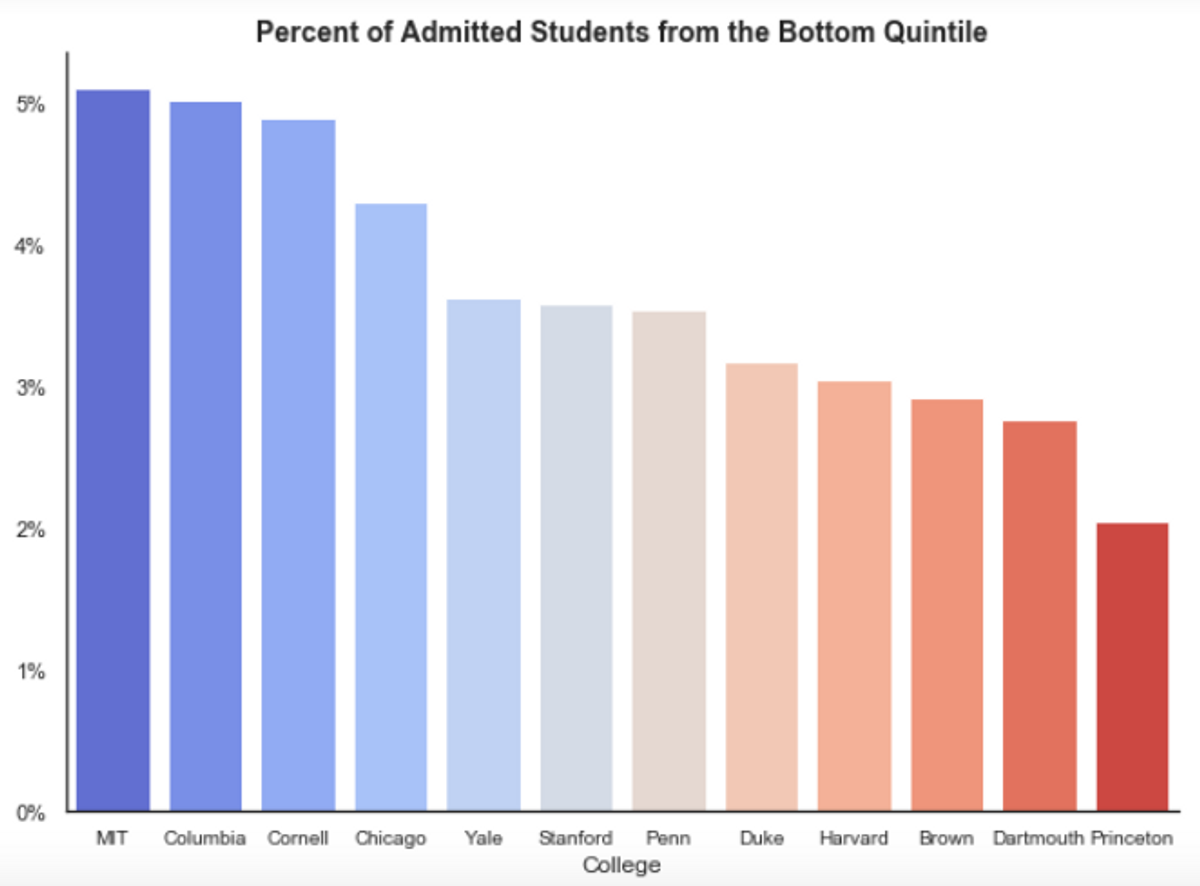
But while those who find their way into Harvard tend to earn a lot, those who do not earn a lot have trouble finding their way into Harvard. The percent of admitted students who come from the bottom quintile of earnings is low at all Ivy Plus schools, but Harvard ranks among the lowest in that fraction. Just over 3% of students at Harvard came from the bottom 20% of earnings, putting it ahead of only Brown, Dartmouth, and Princeton.
Mobility Analysis
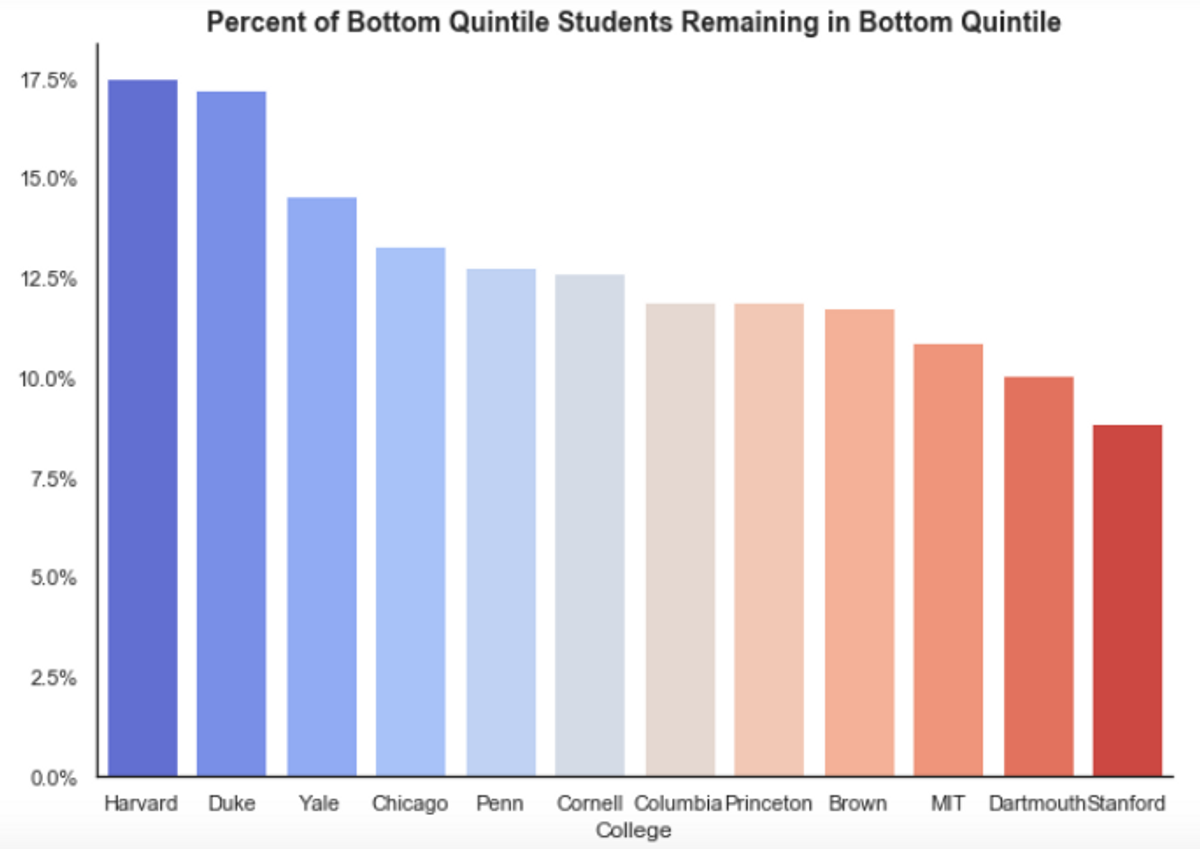
While students from the bottom end of the earnings distribution have a hard time getting admitted into Harvard, those who are too often stay there. Among all Ivy Plus schools, the fraction of students coming from the bottom quintile who remain in the bottom quintile after graduation is highest at Harvard. At just over 17.5 percent, that fraction is nearly 5 percentage points higher at Harvard than its average across Ivy Plus schools. In other words, over one in 6 Harvard graduates coming from the bottom quintile were in that same income quintile after graduation, when Chetty’s team measured adulthood income.
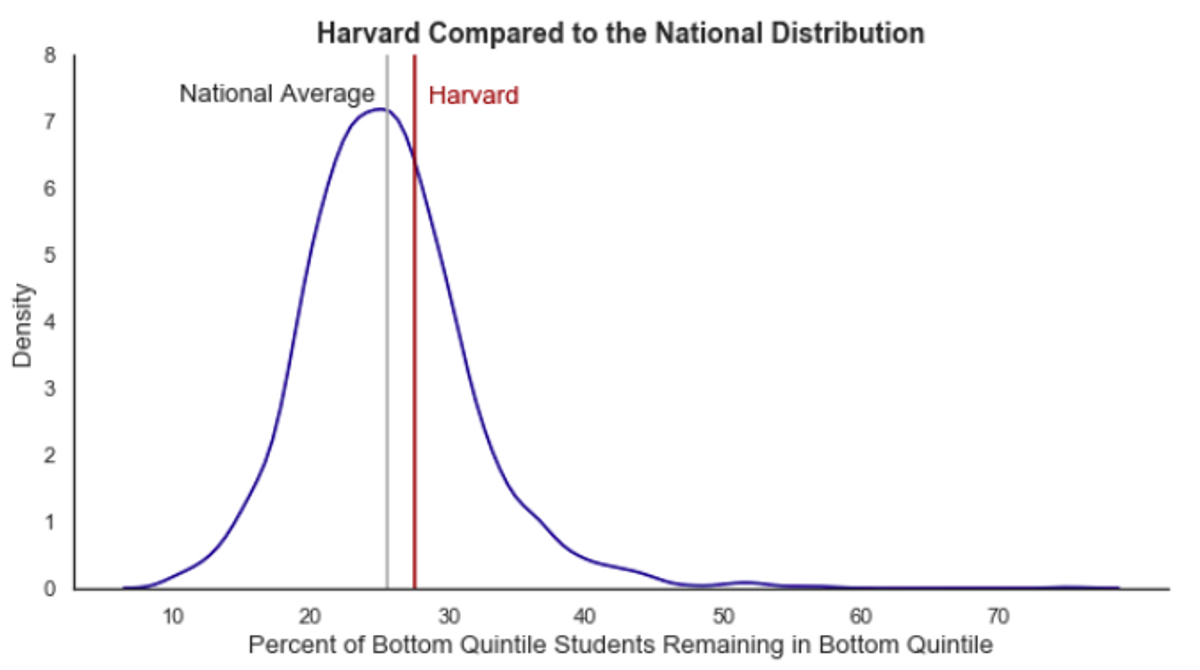
In fact, that percentage isn’t only low by Ivy Plus standards; it’s also worse than the national average. Across all colleges sampled, the average fraction of bottom quintile kids remaining in the bottom quintile after graduation was roughly 15.5 percent, two percentage points lower than the number at Harvard.
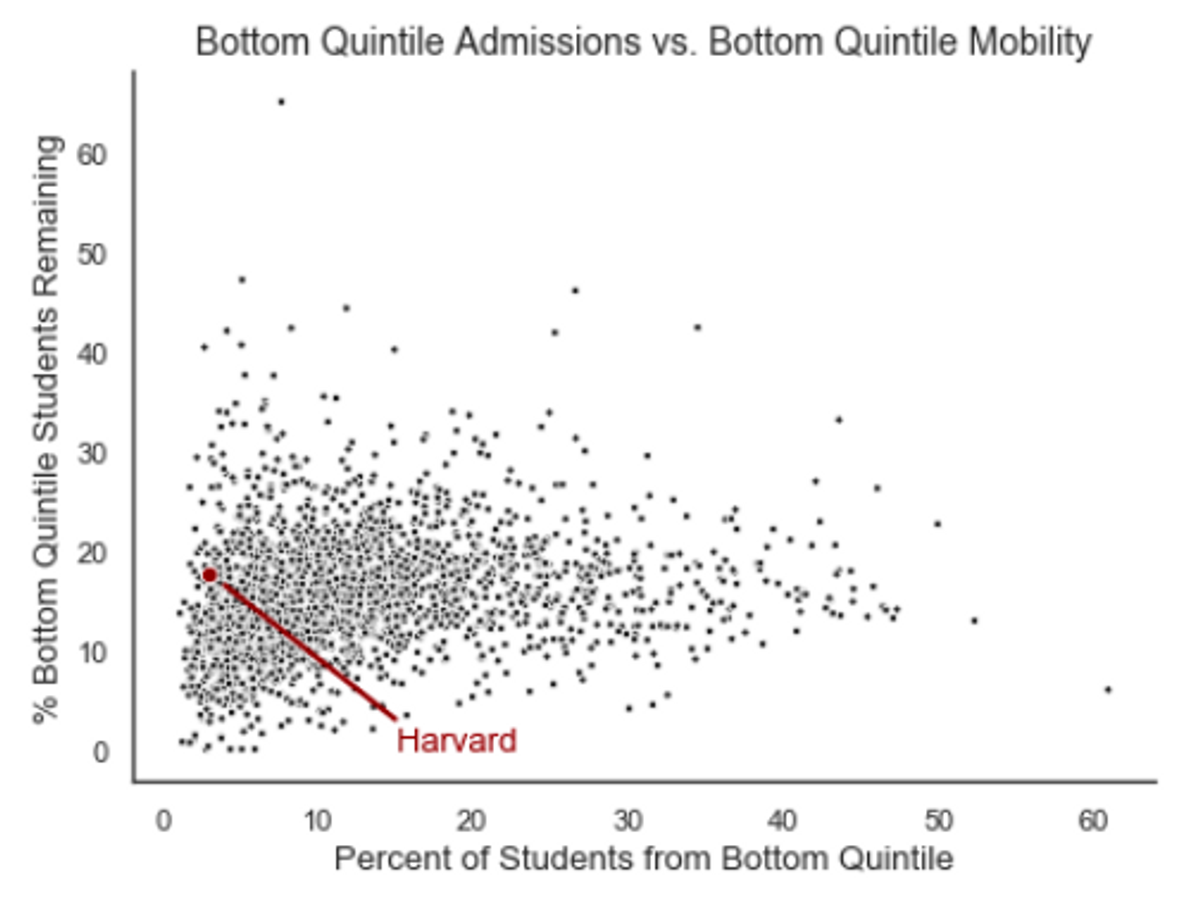
While bottom quintile students face a slightly higher probability of remaining in the bottom quintile after graduation from Harvard by national standards, they comprise a far lower share of the student body compared to the rest of the nation. These two facts combined suggests low-income students face a low probability of gaining admission to the school, and those who do have a harder time getting out of the bottom end of the earnings distribution.
Harvard might be, for instance, graduating students with professional aspirations that are not high-earning, such as non-profit work. It could also provide low-income students with a better chance at graduate school, lowering their earnings in the years soon after college.
The data also doesn’t suggest that Harvard students from low-income backgrounds don’t earn a lot. In fact, over 50 percent of students coming from the bottom quintile end up in the top after graduation. Surprisingly, only around 25 percent end up in the middle three quintiles, which represent over half of the population. This makes students from the bottom quintile more likely to remain in that quintile than to move into any of the three middle quintiles.
Harvard has taken significant effort to remove financial barriers in recent years, making room for more low-income students. The institution has made a goal that no student decides against attending Harvard due to prohibitive costs. But the concern that Harvard has gotten less attention is how those students fare after graduation. Now it’s time for Harvard to focus on those students’ success.