
Literally Nobody Voted in the Quincy Midterm Elections
And more on the shockingly low turnout in the UC midterm elections.
Every spring, the Harvard Undergraduate Council holds midterm elections for any spots that open up (either due to terms ending from the previous midterms or early resignations). This year, the turnout was spectacularly low.
In Lowell House, Tom Brady received more write-in votes than one of the incumbents. He received three ‘1st preference’ votes, while the incumbent received just one ‘1st preference’ vote.
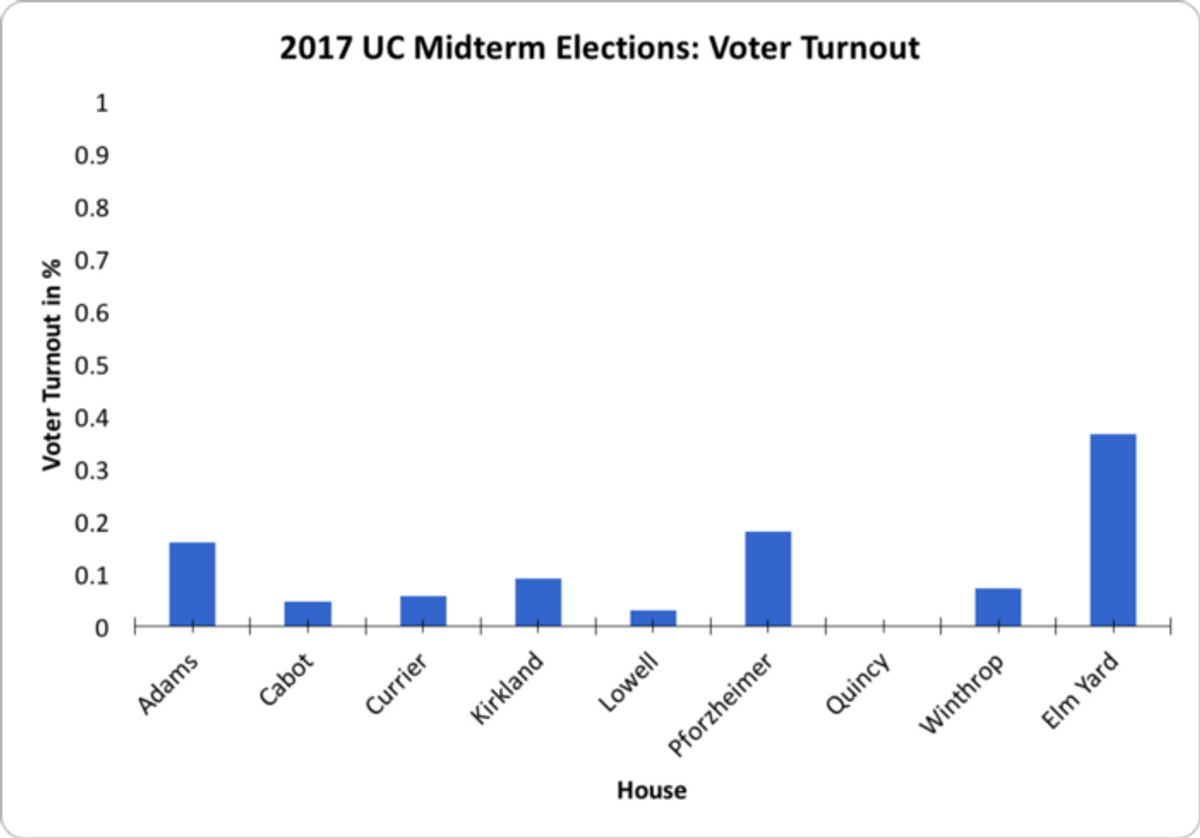 Quincy had the lowest voter turnout: 0%
In Quincy, the voter turnout was 0%. The only candidate who ran did not even vote for himself. Anyone who wanted to be on the UC could have voted for themselves and won.
For this article, we looked at data from the 2017 midterm elections, 2016 midterm elections, and 2016 fall elections.
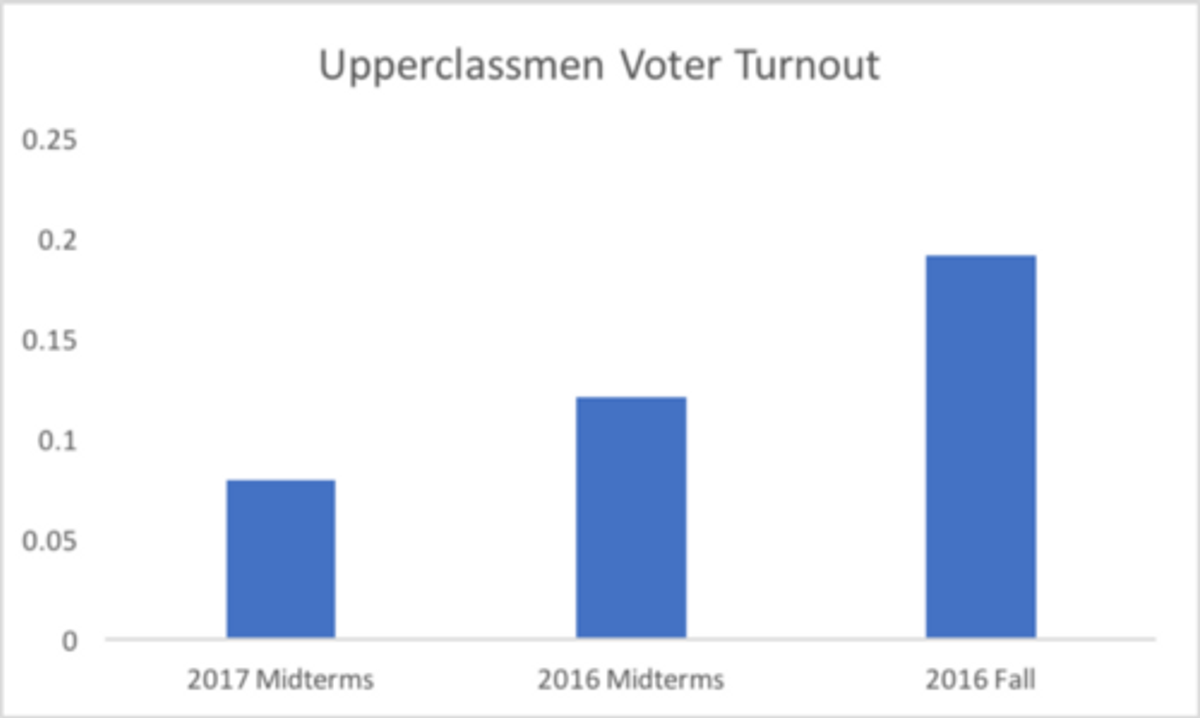
The turnout in the 2017 midterm elections was the worst of the three. In 2017, the midterm upperclassmen turnout was 7.9%, compared to 12.0% in the 2016 midterm elections and 19.1% in the 2016 fall elections. In Pforzheimer House, which had the highest turnout, only 69 voted out of a possible 382 residents (a mere 18% turnout).
Moreover, a side-by-side view of the 2016 fall elections and the 2017 midterm elections shows that with the exception of Adams and Kirkland, voter turnout for the midterm elections was lower in every House.
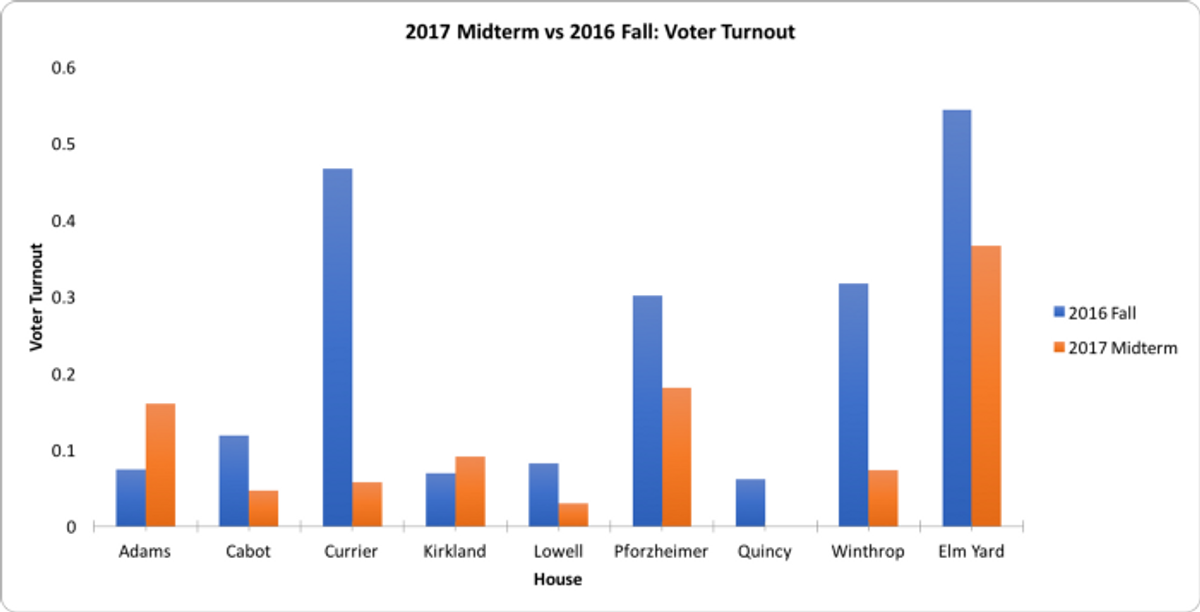
It is clear that the midterm elections are publicized less than the more well-known fall elections.
The purpose of this article is to raise awareness about the low turnout for UC midterm elections and to help find ways to increase voter turnout. While correlation does not imply causation, correlations can show whether existing theories about voter turnout could possibly be true or not.
Before analyzing the data, we removed the freshman yards, as they are outliers in the context of the Houses.
 Straus Hall, a freshman dorm in Harvard Yard. Freshmen have historically had much higher turnouts than upperclassmen. (photo credit: Megan Ross for the Harvard Crimson)
Theory 1: Number of Candidates vs. Voter Turnout
First, we looked at whether voter turnout was correlated with the number of candidates who ran. It has been proposed that voter turnout can be increased if more candidates run. Perhaps, when there are more options to choose from and the election is more competitive, more people will believe their votes will make a difference. It is also possible that the candidates themselves work harder to get people to vote for them, as they face more competition.
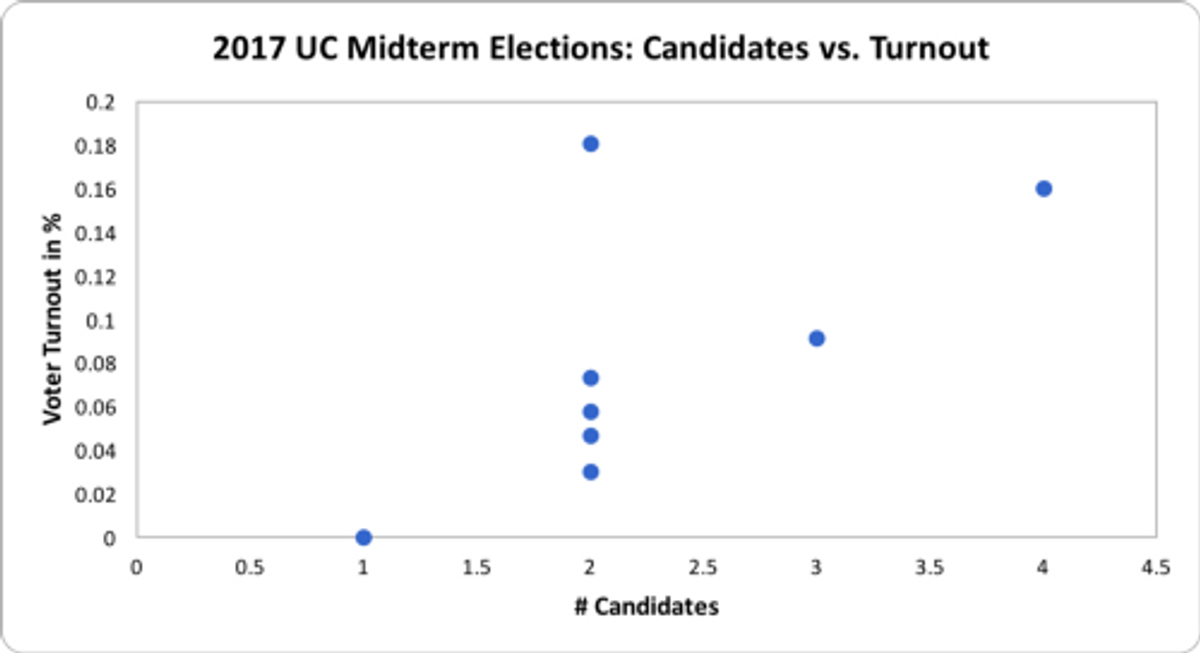 The correlation r² between the number of candidates and voter turnout was 0.42 in the 2017 Midterm Elections
In the 2017 UC Midterms, we found a weak correlation of r² = 0.42. In the data, this is most clearly seen through all the different voter turnouts when there were two candidates running. For that same number of candidates, we saw voter turnout varying from 3% to 18%.
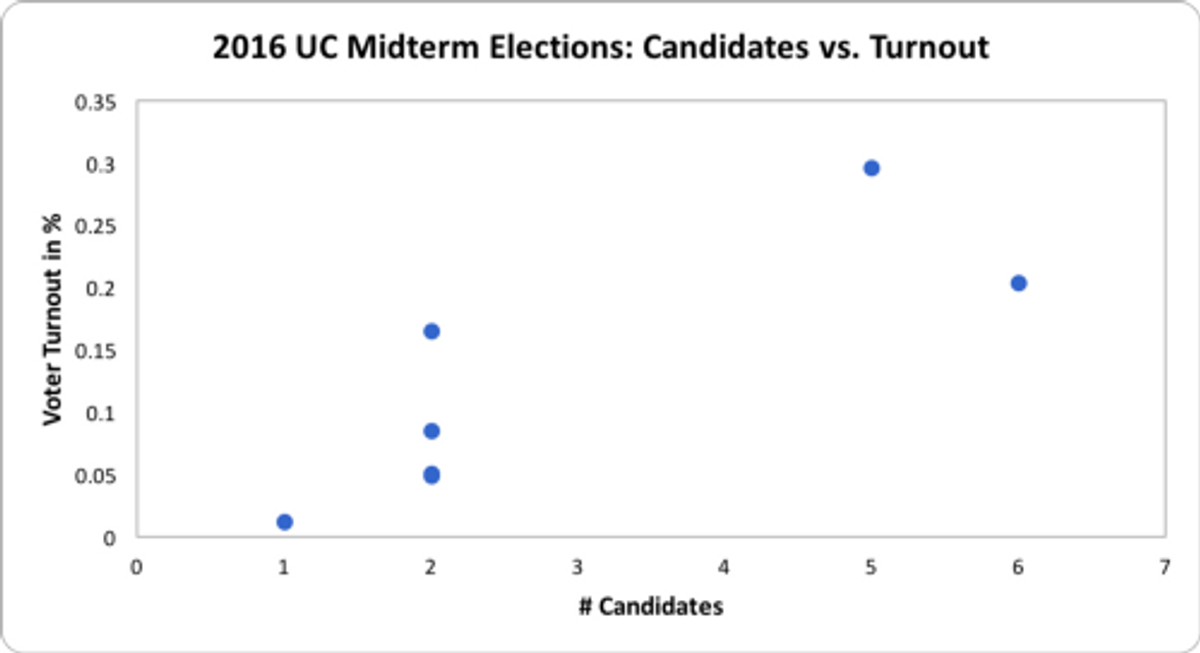 The correlation r² between the number of candidates and voter turnout was 0.68 in the 2016 Midterm Elections
However, in the 2016 UC Midterms and 2016 Fall Elections, we found stronger correlations, with r² being 0.68 and 0.69 respectively. In both these elections, we saw a bigger range in the number of candidates running, with the most being 6 running in Cabot in the 2016 Midterms and 7 running in Currier in the 2016 Fall Elections.
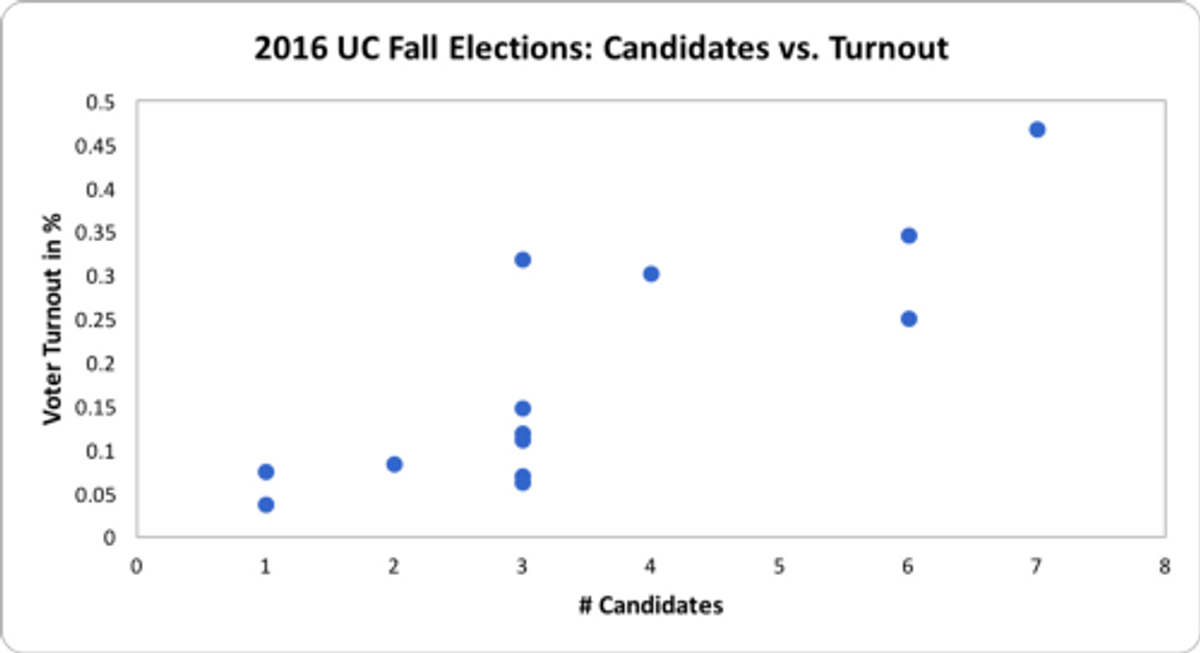 The correlation r² between the number of candidates and voter turnout was 0.69 in the 2016 Fall Elections
While these numbers are not conclusive as the correlation is weak, there is at least a weak positive correlation between the number of the candidates and voter turnout.
Theory 2: House Size vs. Voter Turnout
Next, we looked at how voter turnout correlated with House size. Perhaps the larger the House, the lower the voter turnout, as more people might feel that their votes won’t affect the outcome of the election.
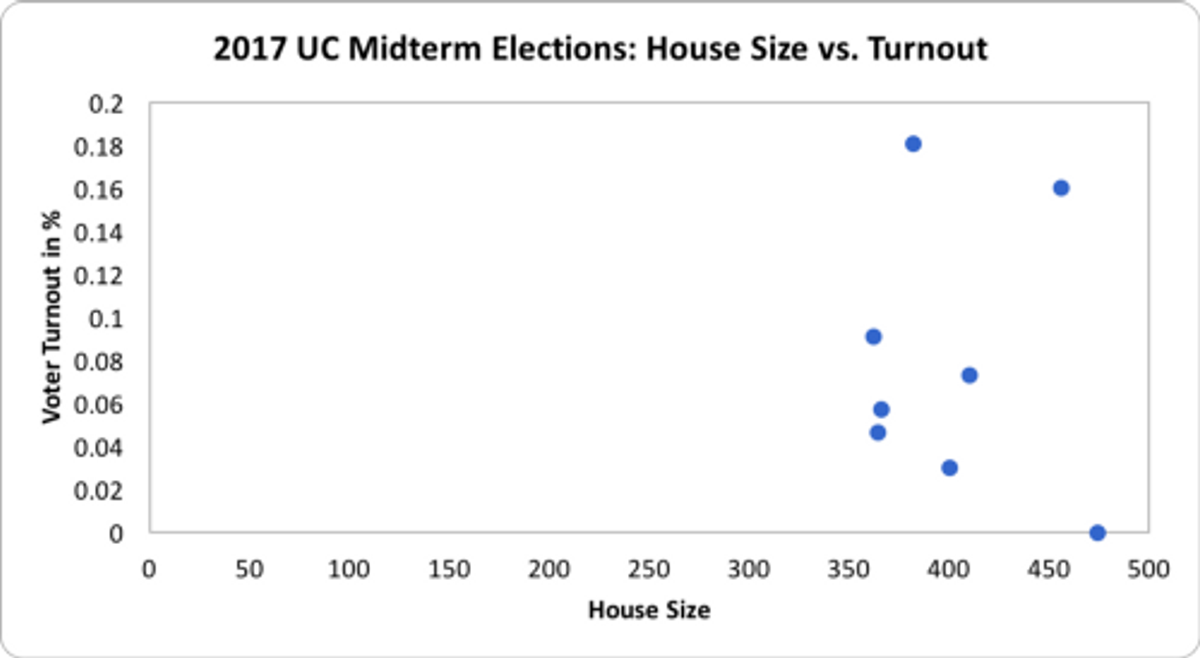 The correlation r² between the House size and voter turnout was 0.009 in the 2017 Midterm Elections
If this were the case, then voter turnout could be increased more effectively by publicizing the elections more in the bigger Houses. However, we found did not find strong negative correlations between voter turnout and House size.
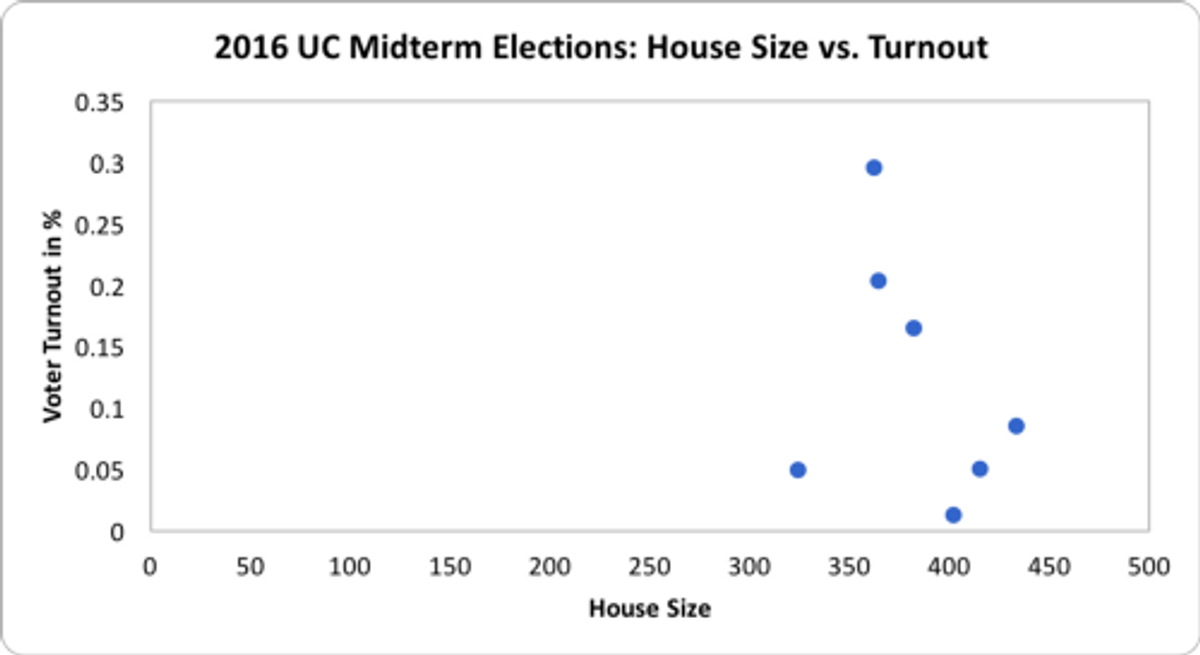 The correlation r² between the House size and voter turnout was 0.10 in the 2016 Midterm Elections
In the 2017 Midterms, the correlation was r² = 0.009. Voter turnout varied regardless of House size, ranging from 0% in Quincy to 18% in Pforzheimer.
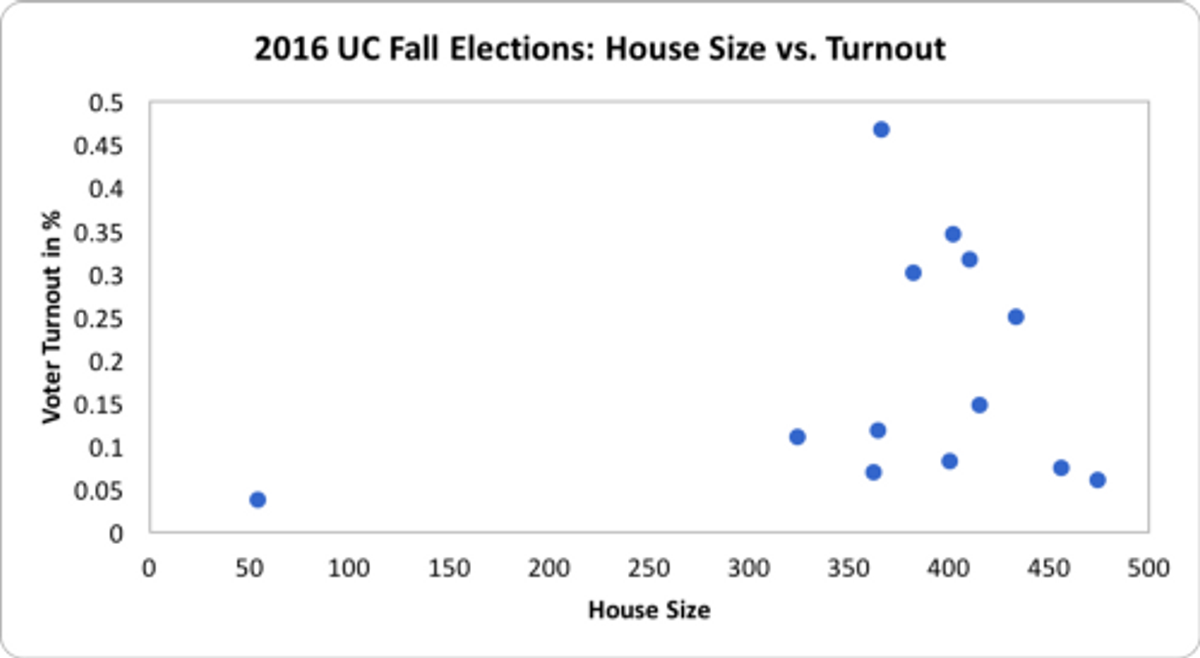 The correlation r² between the House size and voter turnout was 0.05 in the 2017 Midterm Elections
Weak correlations were also found in the 2016 Midterms and 2016 Fall Elections. Like in the 2017 Midterms, the House size simply had no effect on the voter turnout. The r² values for the 2016 Midterms and the 2016 Fall Elections were 0.10 and 0.05 respectively. It seems very unlikely that House size plays a role in turnout.
So how do you fix this abysmal voter turnout?
It seems that the UC can potentially increase voter turnout by encouraging more candidates to run. Otherwise, the UC’s best bet is to publicize the midterm elections more. With an upperclassmen turnout of a meager 7.9% (compared to 19.1% in the 2016 Fall Elections) and a freshmen turnout of 35% (compared to 54%), the midterm elections are clearly publicized less than the fall elections. The UC must take action, and hopefully this article can also help increase the turnout.