

How wealthy are Harvard student clubs?
Examining the public finances of student clubs paints a picture of institutional wealth.
Student clubs are undeniably a large part of undergraduate life at Harvard, with countless pre-professional groups, performing groups, and social organizations to choose from. But for students, it can seem like many of the most exclusive exist in a shroud of mystery.
Despite that, we can shed some light on those that classify themselves as non-profits. Clubs that do so — and gain tax-exempt status — must submit their financial statements to the IRS as part of Form 990, and are required to disclose that information if asked. Much of that public data is made accessible by organizations such as ProPublica, which compiles these forms from various IRS sources.
Analyzing that data reveals a substantial number of clubs with significant revenue streams, with many taking in half a million dollars or more each year. Some, such as Harvard Student Agencies or the Owl, have unsurprisingly large asset bases, but other lesser known organizations also boast substantial revenues; the Harvard Debate Council, for instance, took in over $1.6 million in 2016. The data also shows a substantial gap in assets between primarily male and female social groups — although it indicates that merging or going co-ed boosts clubs’ revenue and helps close the gap.
How Rich Are They?
The data we gathered shows a fairly large cohort of moderately wealthy clubs, with a few outliers taking in $500,000 or more each year. To gather this data, we used ProPublica’s application program interface, a tool for retrieving online information, to retrieve the Form 990 returns available on Harvard organizations.
Harvard publicly lists 478 recognized student organizations. Of these recognized organizations, we found Form 990 returns for 30 clubs with both public data and earnings over $50,000 (non-profits earning under $50,000 are not required to submit detailed financial data). We also compiled data for two currently unrecognized and three previously unrecognized single-gender social organizations, or final clubs. Form 990 summary data was available for information processed by the IRS during the 2012–2017 calendar years, which generally consisted of filings for the 2011–2016 fiscal years.
First, we took a look at the finances of clubs in general. Examining each club’s annual expenses and annual revenue over time begins to show how different groups’ incomes and expenditures compare.
You'll need to follow the link in the caption to view individual club information. There, to view only a specific club’s assets, double-click on their name in the legend on the right. To select or deselect individual clubs, simply click on their names in the legend.
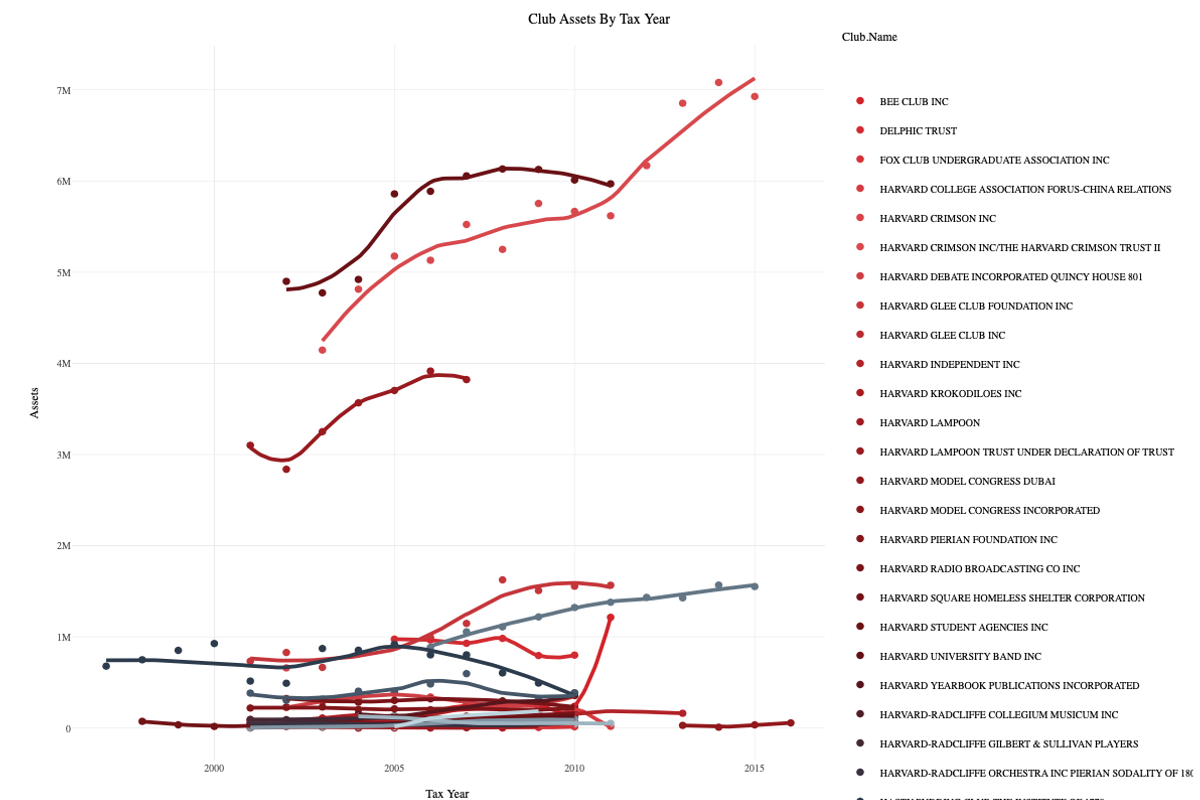 Lines shown on this graph and all following line graphs are calculated using a moving regression (specifically, as documented here). Some display errors may occur when viewing on a mobile device. Access the full graph and dataset here: https://plot.ly/~leosaenger/9
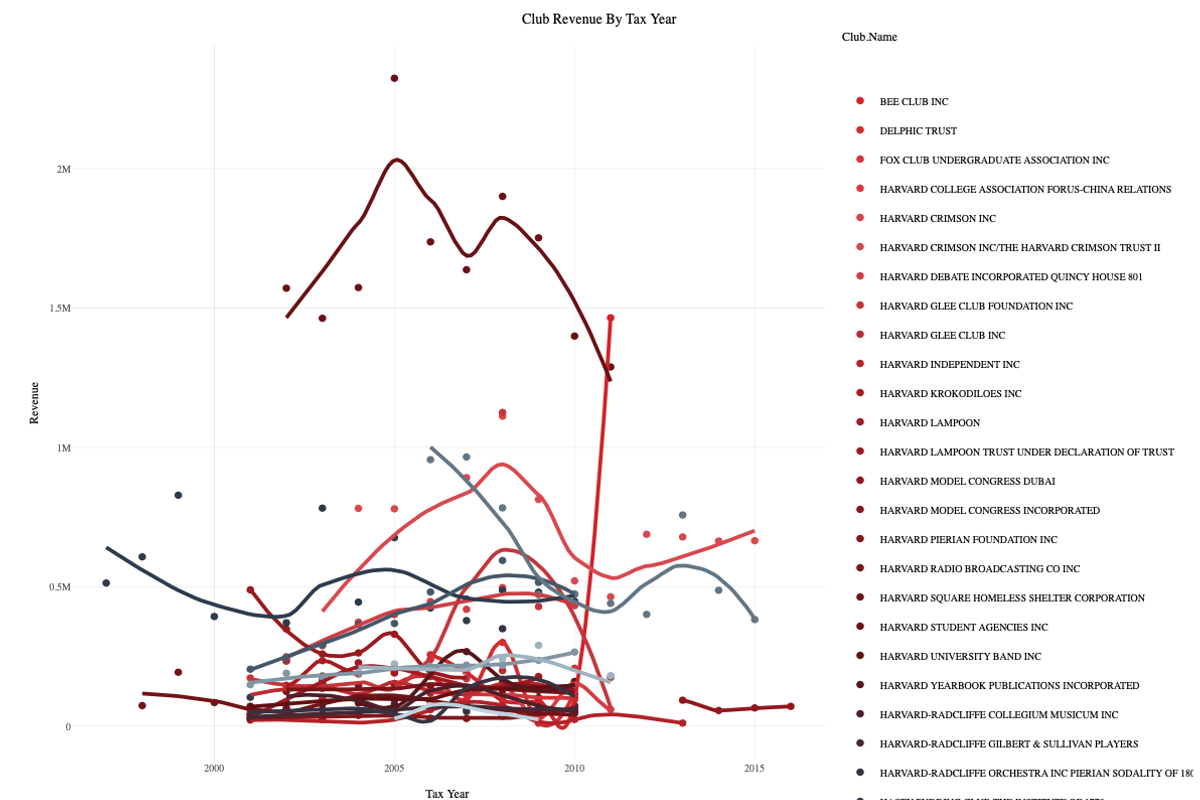 Access the full graph and dataset here: https://plot.ly/~leosaenger/11
The wealthiest clubs, with average annual revenues over $400,000, include The Owl Club, The Crimson, The International Relations Council, The Lampoon, The Hasty Pudding Club, Harvard Debate, and HSA. Of course, clubs with high revenues also tend to have high expenses. Although students at Harvard might expect businesses like the Crimson and HSA to have large net assets, smaller organizations such as the Harvard Debate Council have much larger asset to member ratios.
It’s difficult to know much more than the average revenue and expenses of a given organization — while some clubs, such as HSA, categorize their expenses meticulously, others such as the Lampoon frequently lump their revenue and expenses into “other”, making analysis challenging.
For the most part, clubs spend around the same amount of money as they receive, regardless of group type (primarily social or non-social) or gender affiliation.
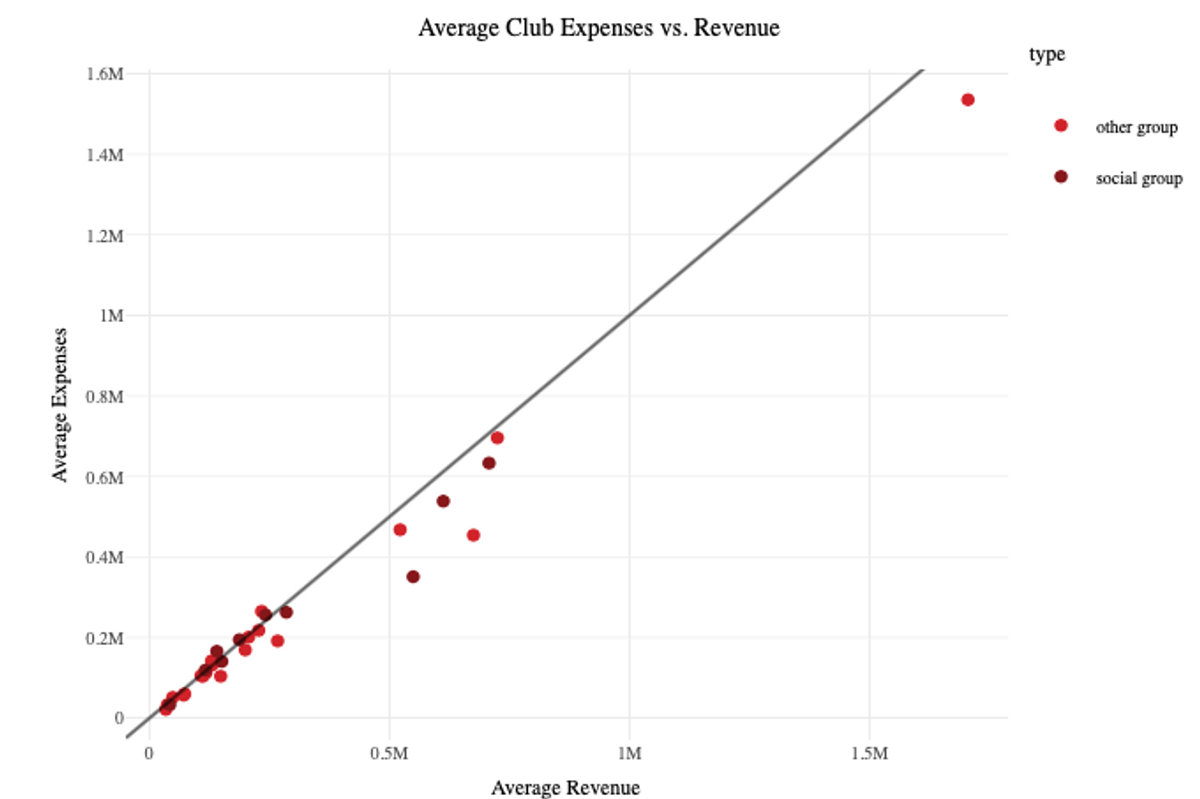 A 45-degree line is provided as reference — clubs below this line make more than they spend, and clubs above the line spend more than they make. Access the full graph and dataset here: https://plot.ly/~leosaenger/1
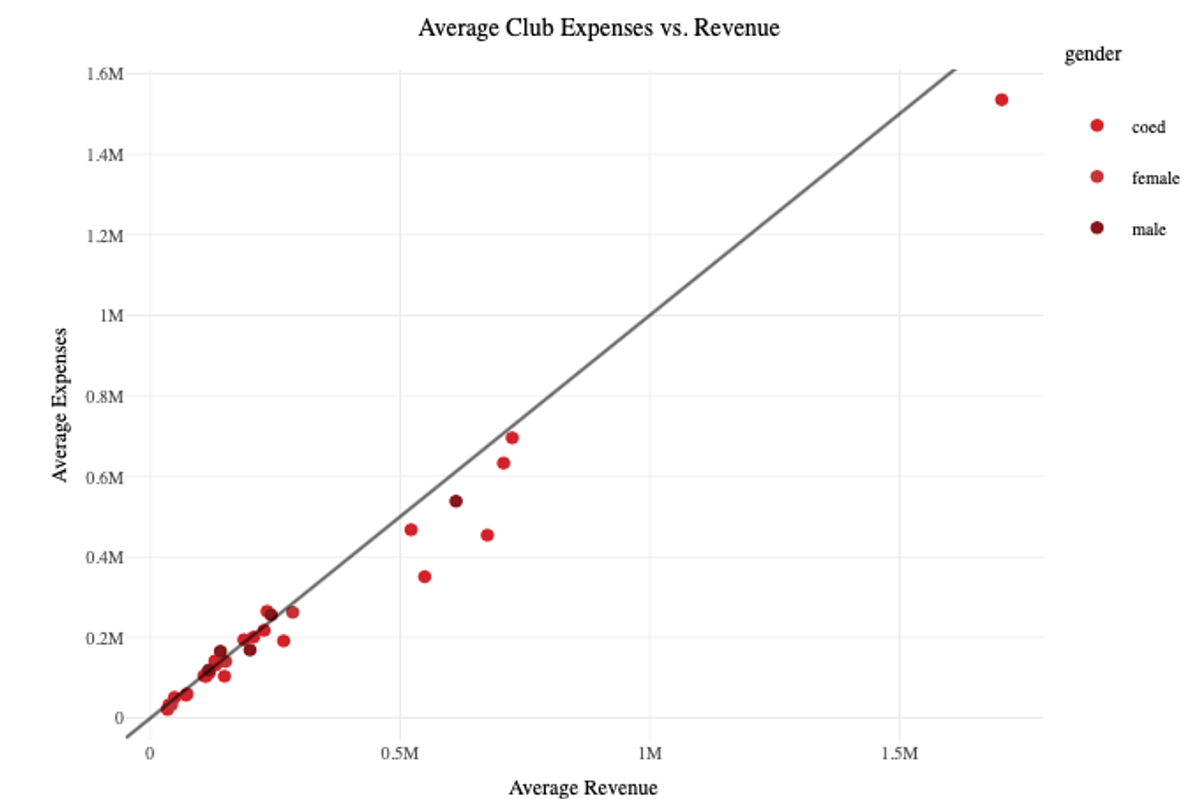 Clubs below the 45-degree line make more than they spend, and clubs above the line spend more than they make. Access the full graph and dataset here: https://plot.ly/~leosaenger/3
Both social and nonsocial clubs vary widely in the scope of their expenses and revenues. Among nonsocial organizations, a smaller group like The Harvard Independent reports an average of around $21,000 in expenses a year, while HSA’s average annual expenses exceed $1.5 million. The highest-spending social group, The Hasty Pudding Club, spends over $600,000 annually, while The Seneca, a smaller group, spends only $35,000. Clubs’ revenues vary so widely that social groups are not conclusively richer or poorer than nonsocial groups.
Final Club Finances
We also looked in more detail at final club finances, especially the sources of their revenue. Final clubs typically depend on membership fees, collecting a few hundred thousand dollars each year, depending on the size of the club. Larger clubs, such as the Owl Club, collect around $400,000 per year, and even more in previous years. Their net assets have been consistently growing for the past decade, and are now valued at approximately $1.5 million.
Final clubs also gain a large amount of their revenue from donations, which can be substantial — in 2011, the Bee Club received a donation of approximately $1.5 million. After large donations, some clubs, such as the Owl, show a consistent growth in assets. Others, such as the Bee, show a spike, followed by a steady decrease.
Some clubs, including the Owl, had separate club and capital management funds. Though the capital management fund only accrues payments in the magnitude of tens of thousands of dollars, its net assets are well over a million. For the purposes of our analysis, we considered these as the same organization, since the club frequently draws from the capital management fund and vice versa.
Changes in Final Clubs
In recent years, final clubs have navigated tighter university sanctions. Regulation now prohibits members of single-gender organizations from certain privileges on campus, such as leadership positions, athletic captaincies, and some fellowships. This has caused many clubs to change their membership practices to become gender-neutral and seek recognition. For the most part, those clubs seeking recognition have seen relative financial success in doing so.
We found that organizations saw an increase in revenue after merging and becoming recognized by the university. When the formerly single-gender Bee Club and Delphic Club merged, the funding of the new group increased dramatically, higher than what could be achieved by simply pooling resources.
The Spee offers another test case for revenue growth after gender integration. Following their policy change to become gender-neutral, the Spee saw a substantial increase in revenue. In 2016, a year after the policy change, they received $427,296 in revenues, an increase of $213,569 or 199 percent from 2014, before integration. On average, 2016 saw revenues $202,555 higher than average in the previous years for which we have data (2004–2014). The same change can be seen in their assets — the Spee’s net assets grew from negative $143,191 in 2014 to a $26,045 surplus in 2016, a gain of $169,236 in just two years.
As revenues outpaced membership and expenses barely increased, the Spee’s financial growth indicates that final clubs experience a positive change in fundraising after adopting gender-neutral policies. Although going gender-neutral could increase member dues, even a doubling would only amount to another $94,824. That leaves at least a $74,412 increase in fundraising that the Spee experienced as a result of changing its policy in 2015 — not a negligible amount.
Given these case studies, we can conclude that the impact of club alumni backlash from gender-neutral transitions is less than the increase in revenues that seeking recognition brings. Final clubs should expect to see an increase in revenue after seeking recognition from the university.
Revenue and asset data also show a substantial and persistent gap between male and female single-gender social organizations. On average over the years in which we had data, there was a $131,855 gap in revenue between primarily male and female social organizations (excluding one outlier fundraising year for the Bee). With respect to net assets, the average gap was $110,939. For primarily female social organizations, that difference is substantial; in the context of their balance sheets, closing the gap would mean an 111% increase in revenue and a 42% increase in net assets.
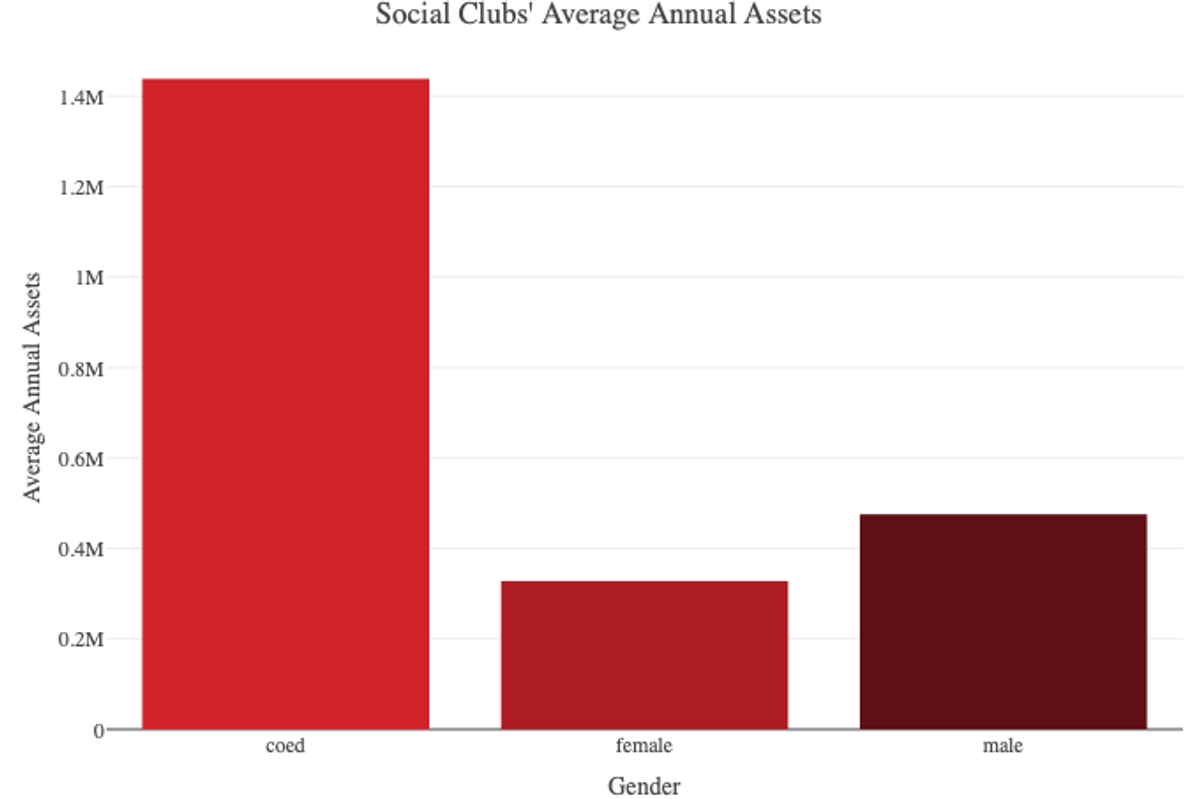 Average Annual Assets by Gender show a clear disparity between gender affiliations.
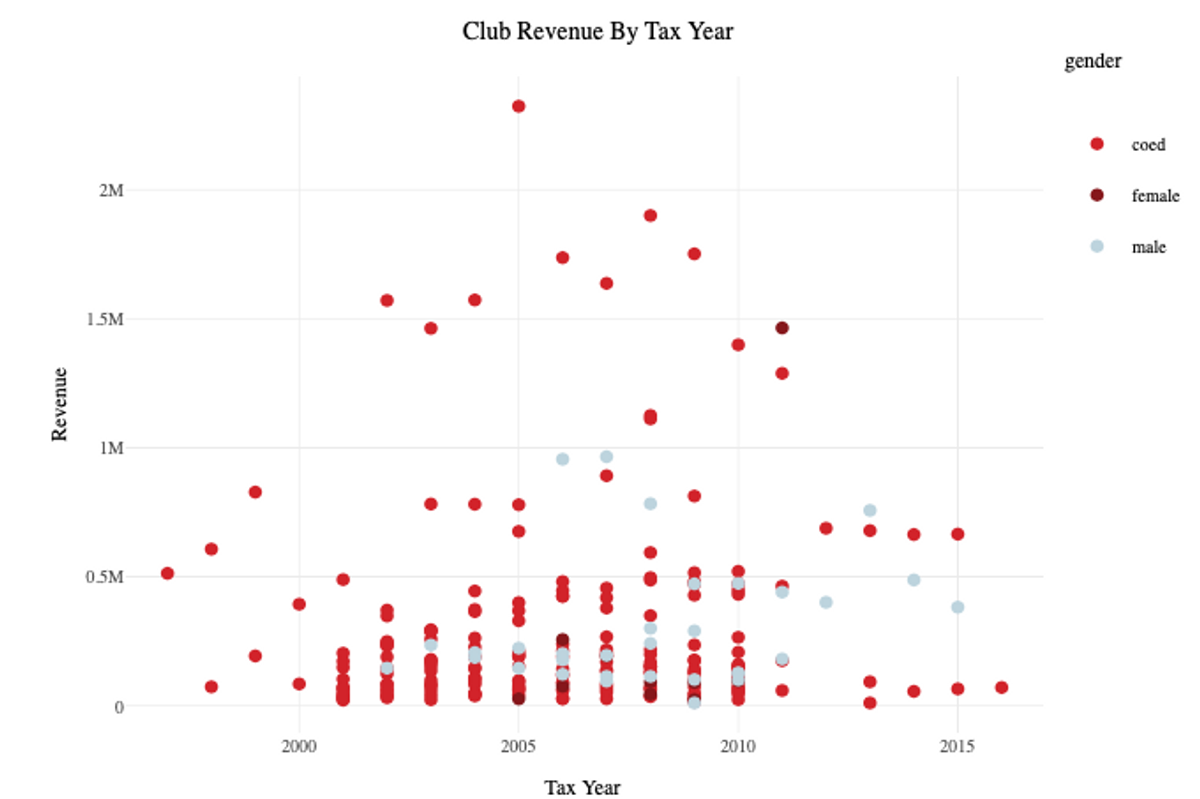 The Bee’s increased revenues after their outlier fundraising year account for the one year in which female single-gender social organizations’ revenues exceed those primarily male ones.
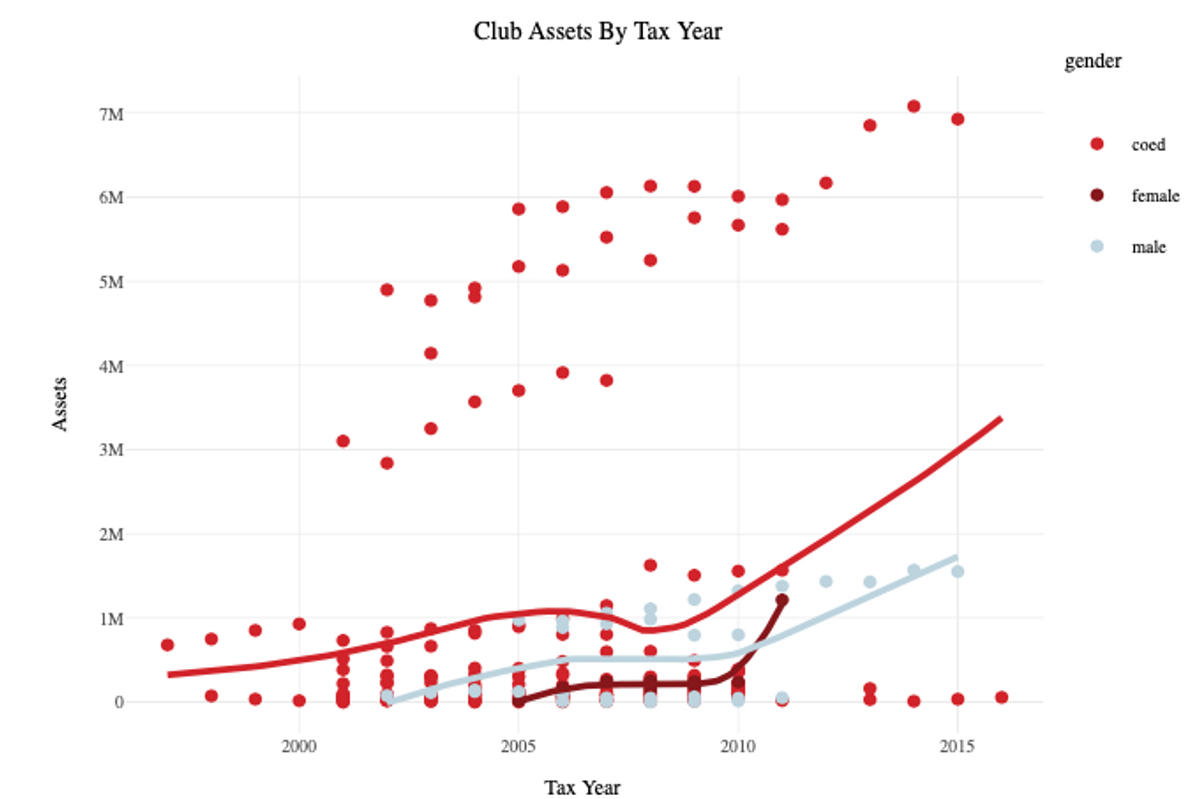 The sole year where female single-gender organizations approached male single-gender organizations in assets is due to the Bee’s outlier fundraising year.
Conclusions
Our data is not without its limitations. The latest year for which we were able to get filings, 2017, was still before the sanctions officially went into effect. In addition, although we were able to find a number of trusts associated with clubs, it’s possible some trusts did not file as non-profits and aren’t accounted for in our data (although the legality of this kind of organization is unclear). Nevertheless, our data does provide a useful overview of student organization finances at Harvard.
ProPublica’s data on various nonprofits at Harvard revealed that many student organizations have annual revenues of hundreds of thousands of dollars, and net assets in the millions. Notable examples are The Crimson, The Lampoon, and Harvard Debate Council. Male social groups have much larger assets than female social groups on average. In the midst of new final club sanctions, social organizations’ revenues tended to rise for clubs that merged to become gender-neutral. Though many aspects of these clubs may still be shrouded in mystery, public data is gives us an inside view of their finances.
This is a project of the Harvard College Open Data Project (HODP), a student-faculty group that aims to use public Harvard data to increase transparency and analyze problems on campus. All data used in the analysis can be found here, and the code we used to compile it can be found here. Thanks also to the Harvard Political Review for editing the article and publishing it on HPR. Finally, many thanks to the folks at HODP who helped put together the original data set.