
How Energy Efficient are Harvard Houses?
As Harvard executes its sustainability plan, housing renovations may actually increase energy usage inefficiencies.
About Harvard’s Sustainability Plan
In recent years, it has become clear that climate change poses a serious threat to our planet’s future and requires immediate action. As the owner and operator of over 600 properties across the country, Harvard has a responsibility to reduce energy usage and emissions across campus.
Harvard University first announced its sustainability plan in 2008, and has implemented initiatives across campus to reduce greenhouse gas emissions. Since 2010, Harvard has conducted energy audits on more than 80% of campus buildings and all energy intensive ones. Their five-year capital planning process includes switching campus utilities fuels and installing renewable energy technology like solar panels. Harvard has also achieved its goal of reducing greenhouse gas emissions by 30% by 2016.
As Harvard facilities implement their sustainability plan, they have also begun renovating campus residential buildings. This article aims to visualize each upperclassman house’s energy usage over time and to examine correlations between building renovations and energy usage.
Data
We used data from the Harvard University Sustainability Data Hub, which provides campus-wide monthly energy usage data for various utilities and buildings. From this data, we selected 10 upperclassman houses and their electricity usage over the last 21 years. Data was not available for Eliot and Winthrop Houses.
Electricity Usage Trends in Campus Housing
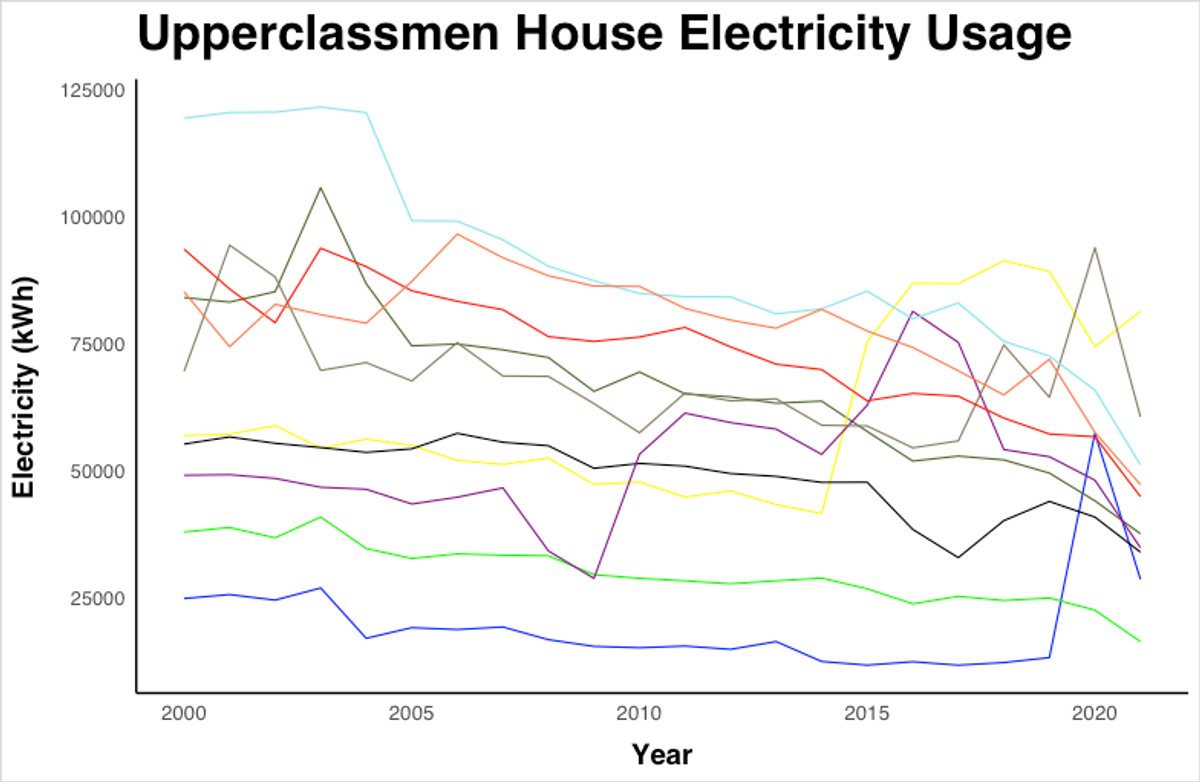 Figure 1: Total amount of electricity used (in kWh) by Harvard upperclassmen house since 2000 (by year)
The amount of electricity used (measured in kWh) declined over time for most houses, with the exception of Leverett House, Lowell House, Adams House, and Dunster House, which experienced periodic spikes.
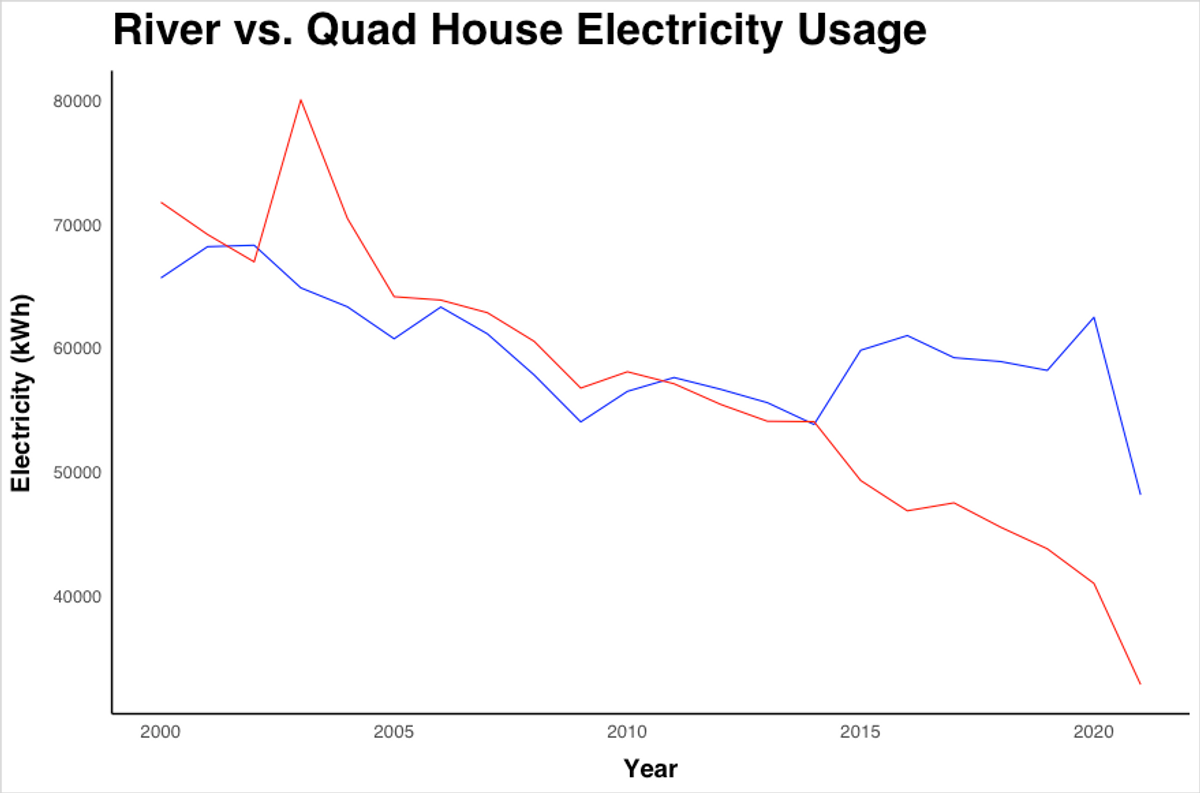 Figure 2: Yearly electricity used (in kWh) by Harvard upperclassmen house since 2000, grouped by region of campus.
In Figure 2's line plot, we can gain an overarching understanding of monthly electricity usage across the upperclassmen houses over time, segmented by houses along the Charles River and in the Quad.
Renovations and Energy Usage
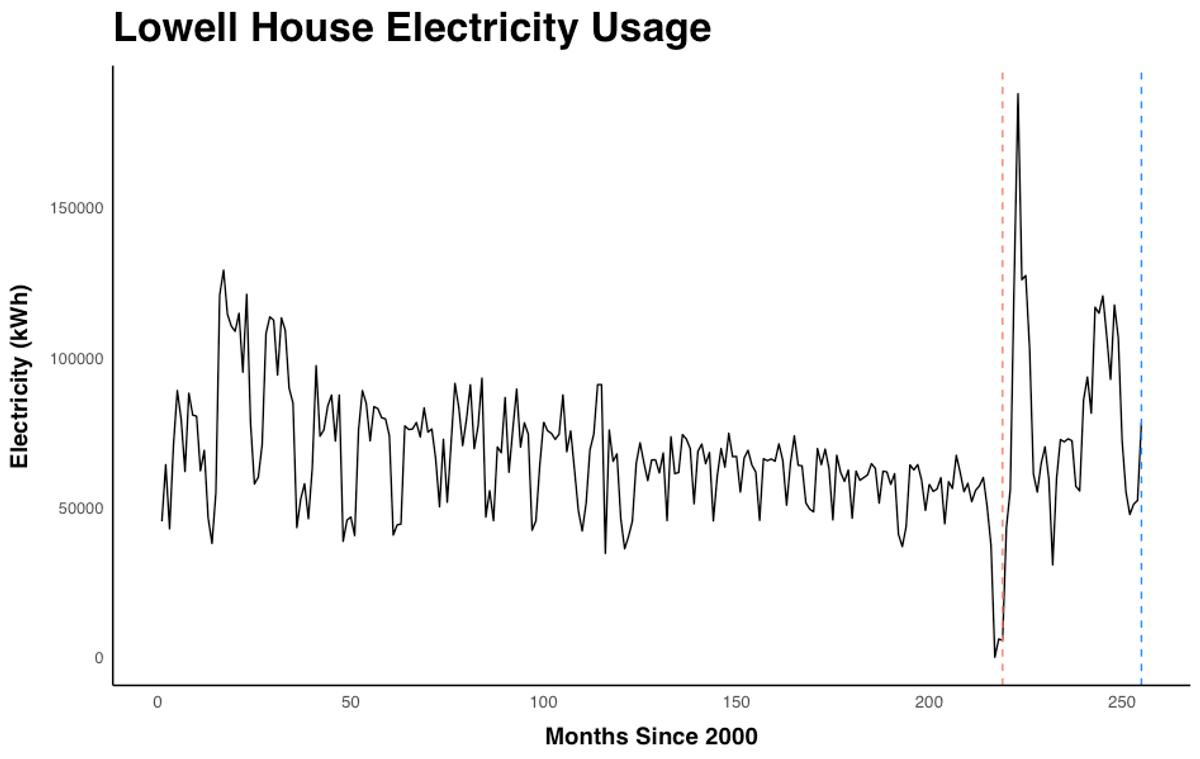 Figure 3: Total amount of electricity (in kWh) used by Lowell House since 2000 (measured in months)
Honing in on Lowell House’s electricity usage since 2000, we can see that a massive uptick in electricity usage occured in May 2017, denoted by the red vertical marker, which is also when Lowell House began renovations. The renovations in Lowell lasted 2 years, ending in September 2019, but its electricity usage fluctuated to higher levels than prior to the renovation. Lowell’s buildings and courtyards received extensive electrical, mechanical, and structural upgrades during their 2-year renovation, including the restoration of the House’s 56 chimneys and energy-efficient upgrades to 1,100 windows.
The higher levels of electricity consumption could be related to the addition of new amenities in Lowell’s previously underutilized basement area or a transition from other energy sources to electricity, which we lack the data to confirm.
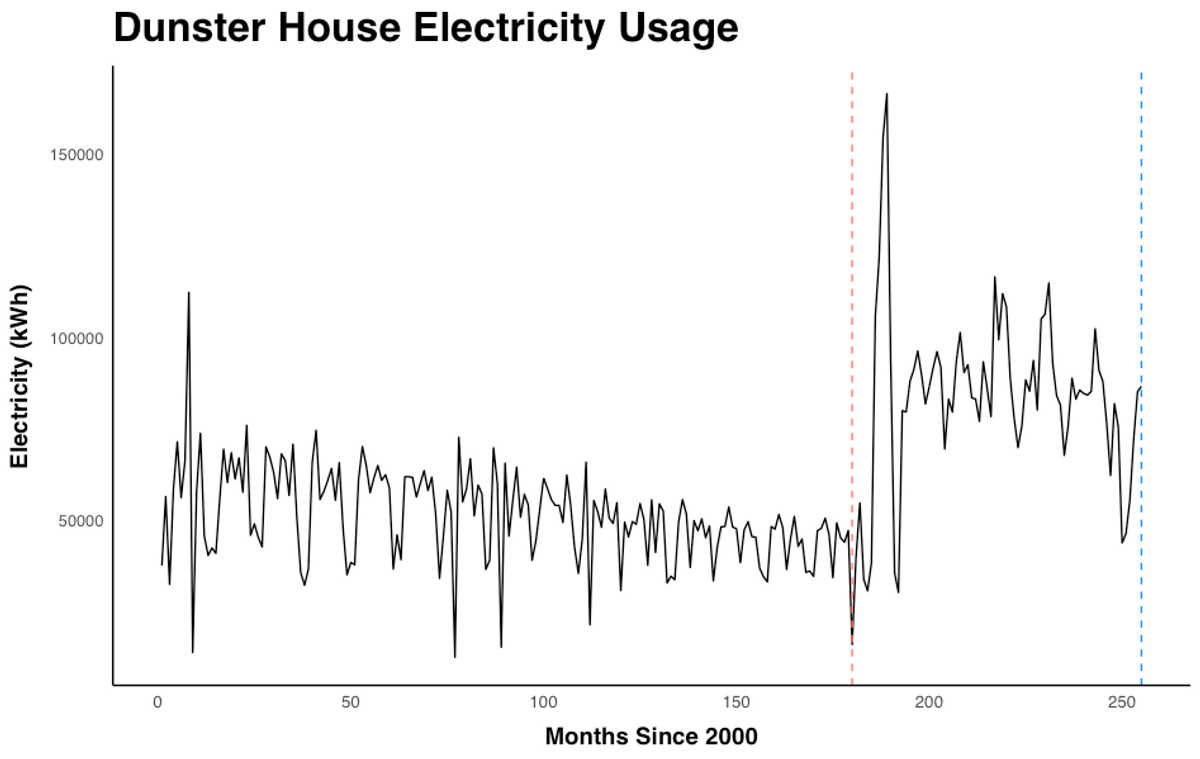 Figure 4: Total amount of electricity (in kWh) used by Dunster House since 2000 (measured in months)
The sharp uptick in Dunster’s electricity usage also occured after the beginning of Dunster’s renovation in May 2014. After a 15-month period of renovations, the electricity usage declines, leveling out to fluctuations around 100,000 kWh, which are higher levels than prior to the renovation. The renovations increased House event space by 33% and updated infrastructure to implement air conditioning for all suites, possibly related to the higher levels of electricity usage in recent years.
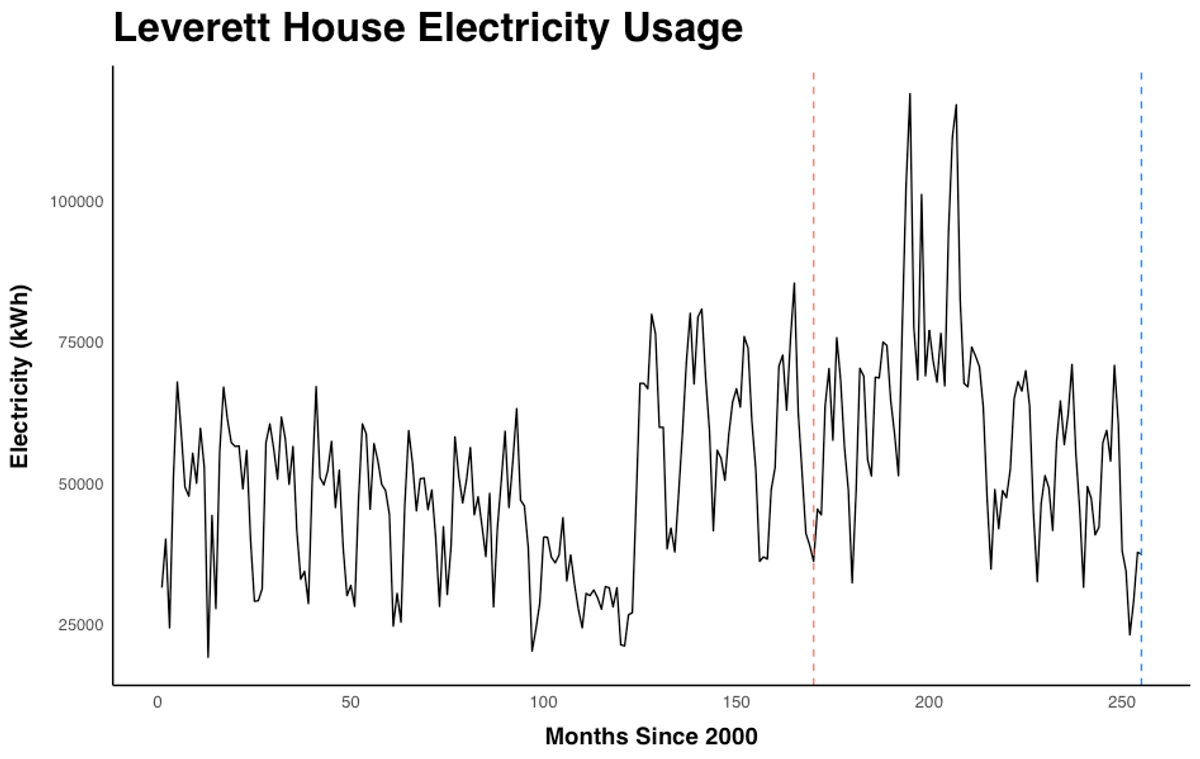 Figure 5: Total amount of electricity (in kWh) used by Leverett House since 2000 (measured in months)
Leverett’s renovations began in August 2013, and its electricity usage briefly fluctuated during the 15 months of construction. In order to understand the cause of the rise in electricity usage from 2016-2018, however, we would need more data of the energy sources used in Leverett House and house-specific infrastructure updates that occurred during the time period to cause the dramatic rise.
Conclusion & Reflection
Cross-analyzing Figure 1 with Figures 2, 3, and 4, we can see that the abrupt spikes in electricity usage for Leverett, Lowell, and Dunster in recent years correspond to their periods of building renovations. In the case of Dunster, energy usage actually increased after renovations were made. This calls into question whether these renovations were made with the Climate Change Action Plan in mind. Moving forward, as more and more houses are renovated, it is important the highest energy efficiency standards are met.
On the other hand, Mather House, having not undergone any major renovations since its construction, has consistently decreased its energy usage over the last 20 years and now has a yearly average energy usage that is 57% lower than it was in the year 2000. There could be confounding variables resulting in these energy usage trends beyond renovations and new building technology, so we cannot definitively conclude that Mather’s energy usage trends are caused by renovations.
Ultimately, there are many factors such as building age, quantity of buildings, and seasonality that play a factor in determining any house’s monthly energy usage. In further analyses, we can explore the usage trends in other energy types, such as steam and natural gas, as well as research how the percent decrease in energy consumption in the upperclassmen houses compares relative to Harvard University’s total energy consumption.
Moving forward, Harvard will continue to track and quantify its Scope 3 fossil fuel emissions – namely food, air quality, travel, and commuting – and work to purchase externally-provided services that minimize their reliance on fossil fuels as part of their plan to become fossil fuel-neutral by 2026 and fossil fuel-free by 2050.
Check out the data and code for this project here.