

Harvard’s Most (and Least) Desired Houses Updated: Housing Day 2019
An analysis of how each of Harvard's houses rank against each other going into Housing Day 2019.
On March 14, 2019, Harvard’s annual Housing Day took place. Before freshmen discovered their homes for the remainder of their time at the College, the Harvard Open Data Project collected data from over 200 freshmen through a survey sent over various email lists and compiled all things housing-related. Students ranked all 12 upperclassman houses from 1 (most desirable) to 12 (least desirable), reported their blocking group size, and recorded other miscellaneous data.
We’re going to need a bigger block
The most popular blocking group size among respondents was eight, the maximum size for a blocking group. 31.5% of respondents reported a blocking group of size eight. The second most common group size was six with 20.7% of respondents, closely followed by a group size of seven with 15.8% of respondents. Notably, “floaters”, or blocking groups of just one person, represented 3% of respondents, comparable to the respondents with groups of sizes of two or three.
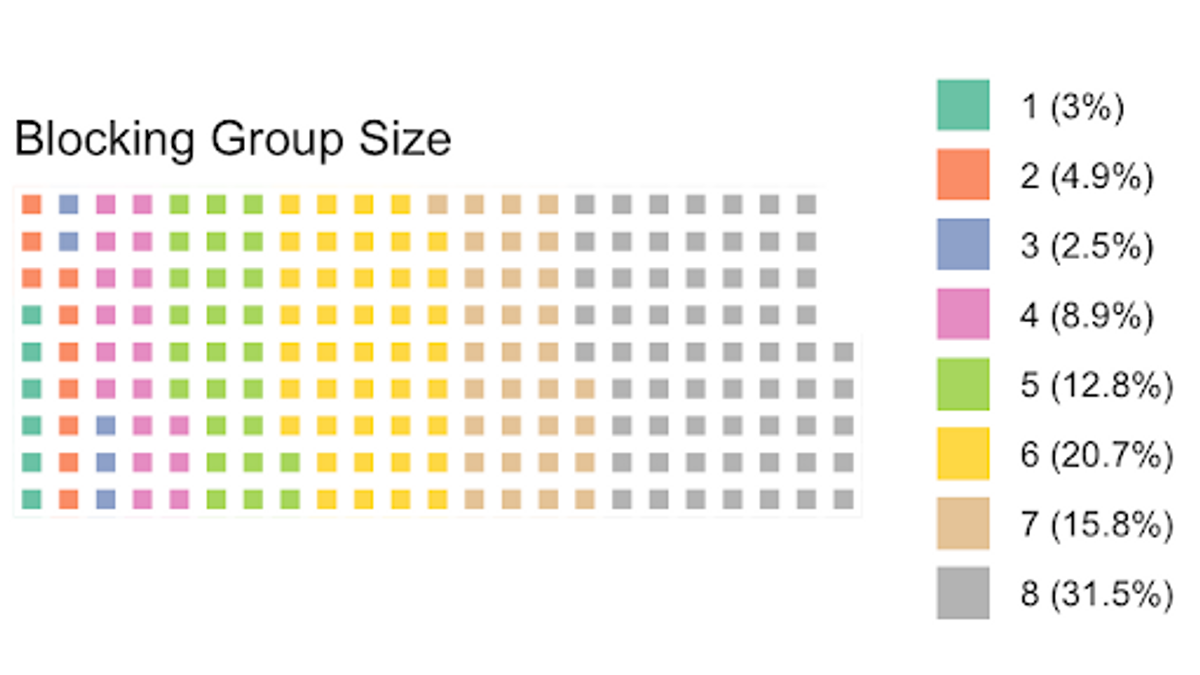
It is important to note, however, that this data represents the number of students in blocking groups of a certain size rather than number of blocking groups of a certain size. Those in larger blocking groups will also by definition make up a larger portion of the respondents. For example, if there were only two blocking groups of size 1 and of size 8, 88.89% of students would report being part of an 8 person blocking group, while only 1 would report as being part of a 1 person blocking group, assuming everyone answered the survey. On that point, a confounding variable may be that those in larger blocking groups are more social and more inclined to respond to our survey.
Renovation!
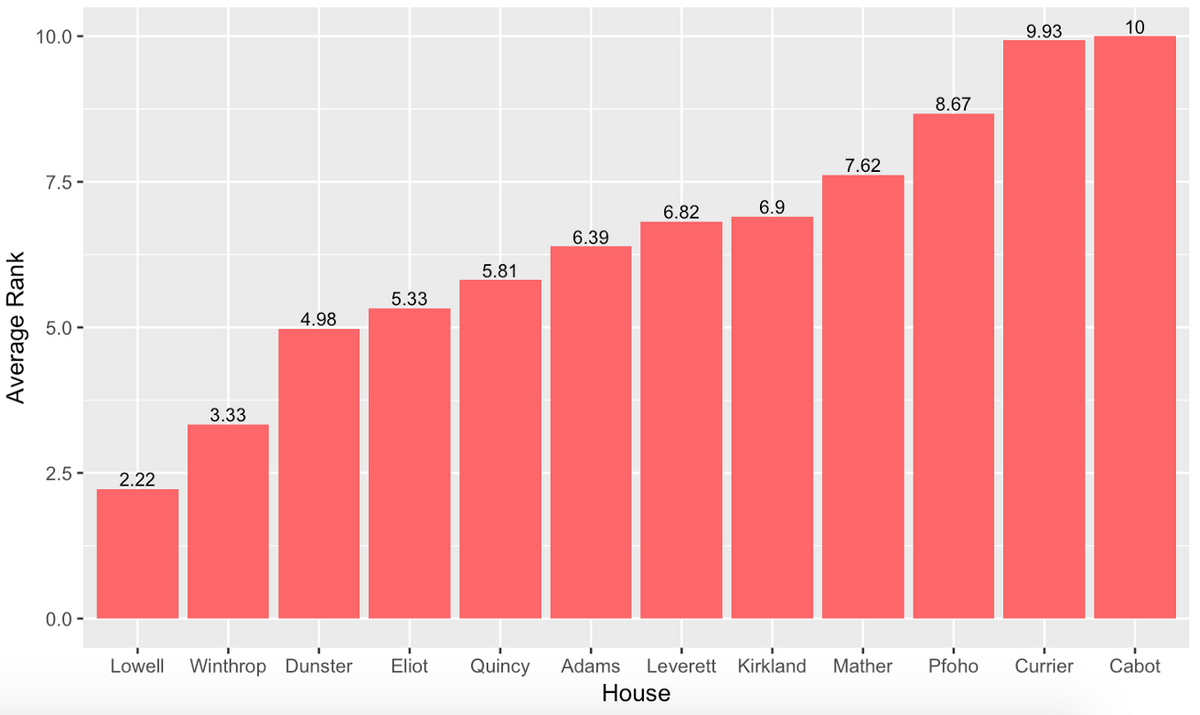
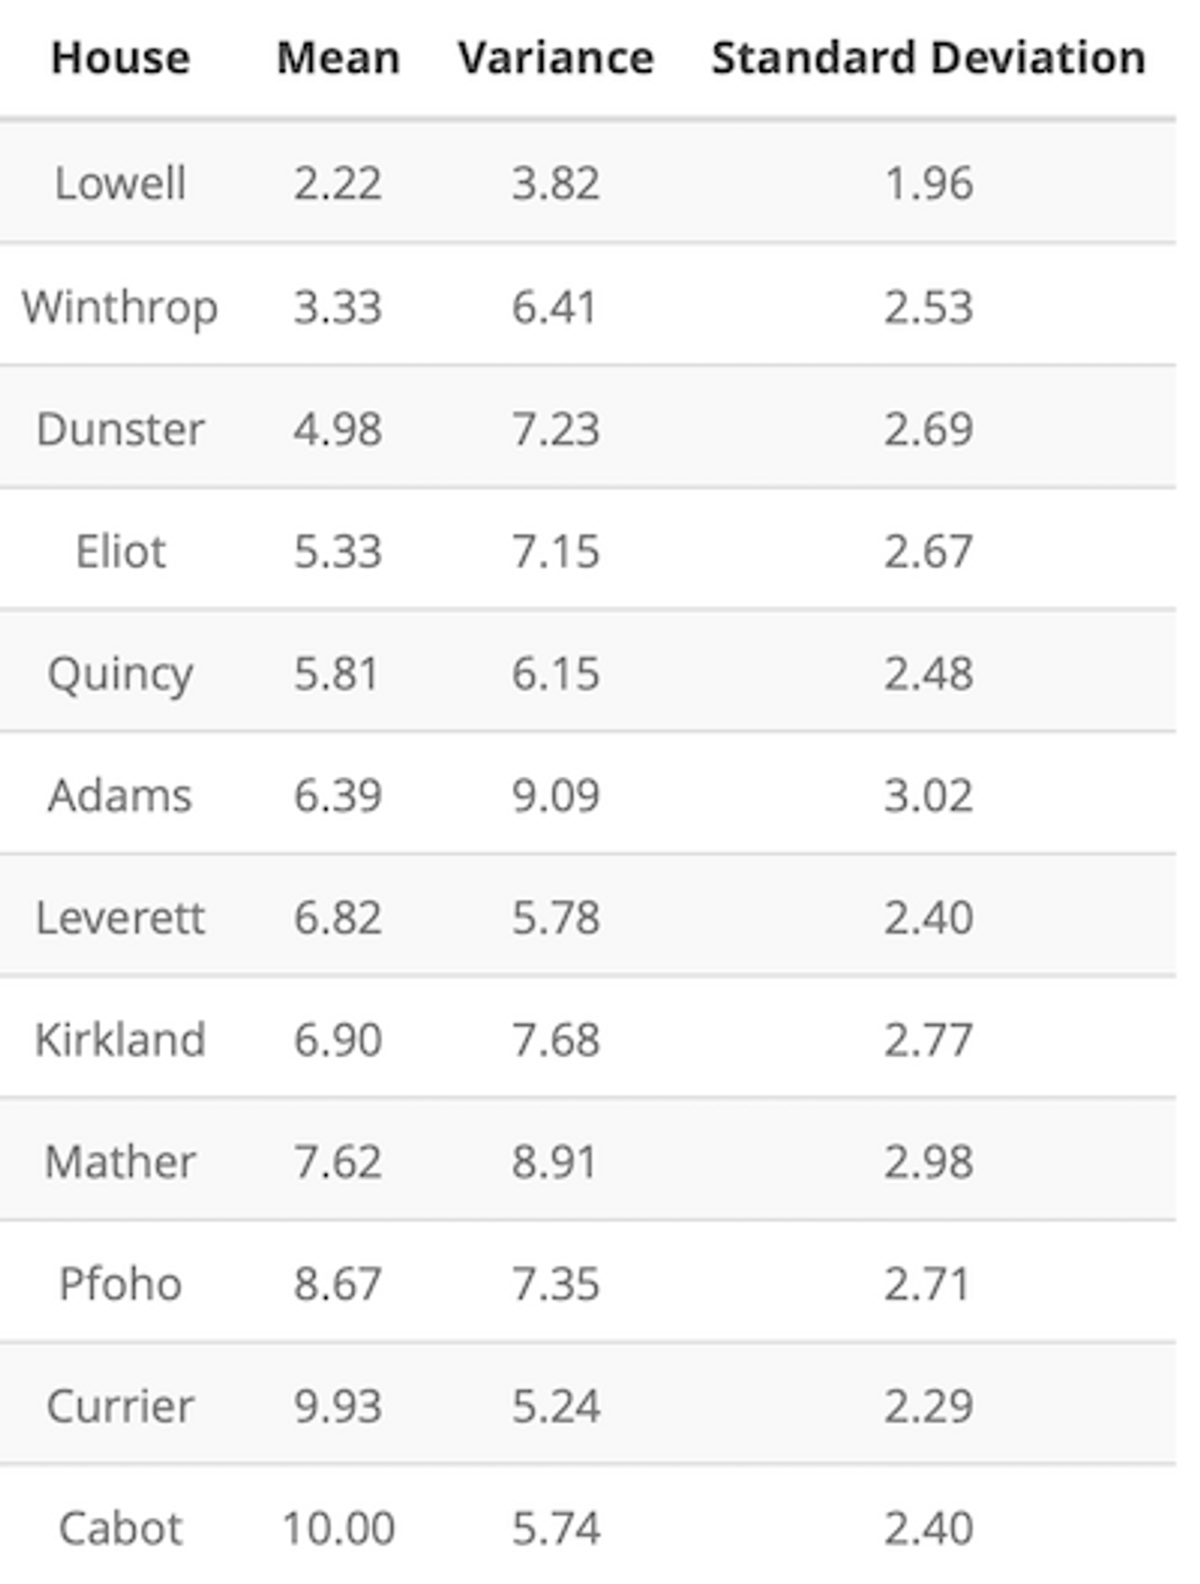
Despite two years of ‘Throp reigning as the most desired and most recently renovated house, with the Lowell’s renovations scheduled for completion at the beginning of next semester, Lowell was finally able to surpass Winthrop this year as the most desired house with a mean score of 2.22, outperforming Winthrop’s mean score of 3.33. Notably, this year’s top three most desired houses (Lowell, Winthrop, and Dunster) have all been renovated within the past five years. Additionally, 58% of respondents ranked Lowell as their number one choice and no student ranked Lowell as their 11th or 12th pick.
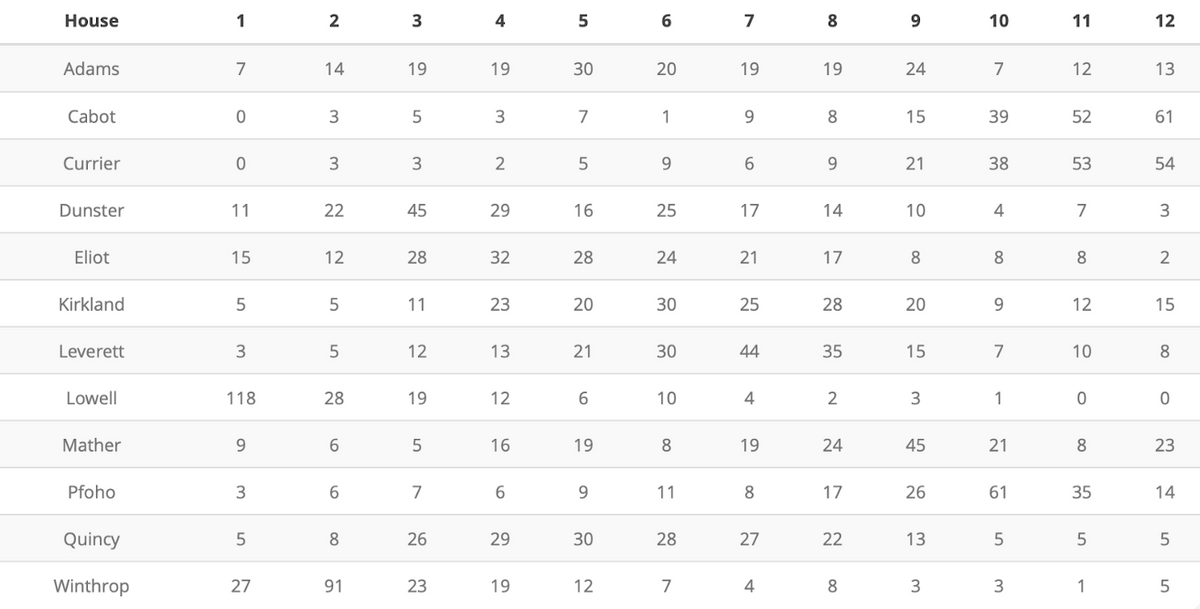
Unsurprisingly, the three Quad houses are ranked last again, although Pforzheimer’s rankings showed a small increase, while Currier and Cabot’s scores decreased when compared to last year’s preferences. 30% of students ranked Cabot last, and 27% of students ranked Currier last, while not a single student ranked Currier or Cabot as their number one choice. Only three students had Pfoho as their top pick.
 Houses ordered by average rank
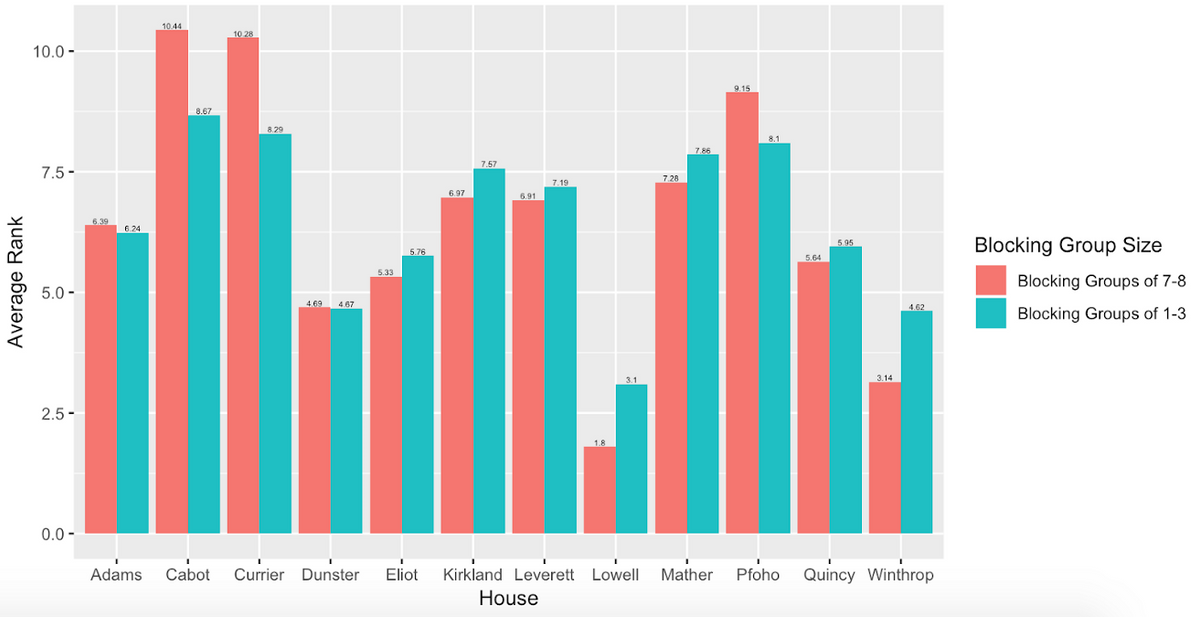
There appear to be preference trends among blocking groups of different sizes. For example, large blocking groups (defined here as those with seven or eight students) show a greater preference for River Houses like Lowell and Winthrop than smaller blocking groups (with one to three students). Additionally, smaller blocking groups appear to be more accepting of the quad houses, ranking them two places higher on average than their large blocking group peers.
 Blocking group size and preference
You Miss 100% of the Shuttles You Don’t Make
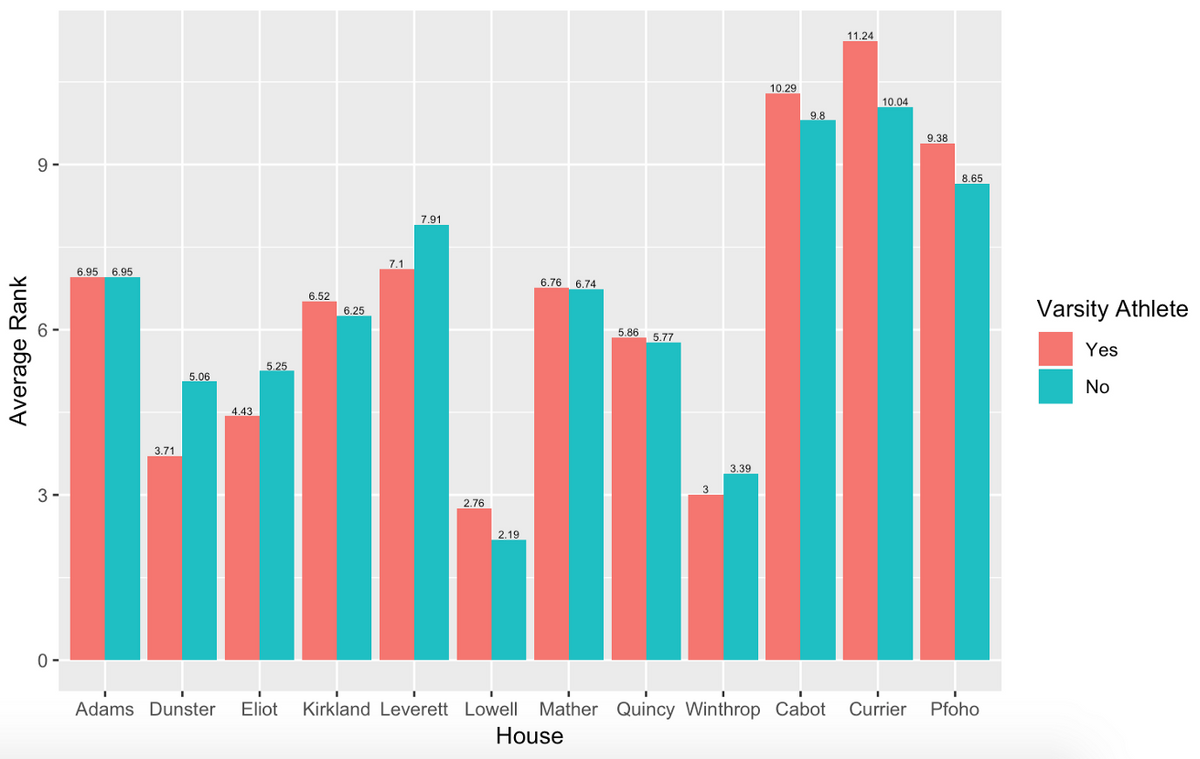
When it came to housing preferences of varsity athletes versus non-varsity athletes, athletes tended to rank the quad houses less preferably. Varsity athletes gave Currier House an average ranking of 11.24 in comparison to the non-athlete ranking of 10.04. This gap is notable in the ratings of the other quad houses as well. Athletes also showed a significant preference for Dunster House, ranking it on average as 3.71 compared to 5.06 for non-athletes. This may be due to the fact that Dunster has extended meal times to accommodate the demanding schedules of many varsity athletes.
 Athlete status and preference
Adams, the Comeback Kid?
Adams, a house that placed 8th last year with a mean score of 7.59, has shot up to 6th place with a mean score of 6.39. This may be correlated with Adams being the next house slotted for renovations. Some students will receive swing housing for the 2019–2020 school year. Although Adams was able to climb the rankings, it did not experience the same surge that houses like Lowell have received in the past. This may be because Adams renovations are set to happen over the next 4 years, meaning that larger sections of the house will remain open at each time. Thus, rising sophomores will not be able to live in a fully renovated Adams during their time at Harvard, nor are they guaranteed swing housing in 2019–2020.
 Houses ordered by average rank, with spread
Every House is the Best House!
Whether you find yourself in brand-new Lowell, historic Adams, or even one of the spacious and tight-knight quad houses, you will certainly be in the best house for you! What makes a house a home is not the number of singles or its proximity to the Yard, but the people who live there. Although some students report initial disappointment after being housed, in the end, most students end up preferring the house in which they live. No matter how you felt this housing day, you will soon be storming future freshmen to tell them that they, too, won the lottery.