
Harvard Housing Part 2: How Do Students Form Groups?
Second post in a series investigating housing at Harvard using data science and statistics.
The first post in our series about housing at Harvard explained how the system works and explored a question asked by countless students: Who gets Quadded? In this post, we’ll move away from how Harvard assigns housing and examine how students form groups amongst themselves.
But first, a quick recap of the data we’ve used. 834 Harvard freshmen — just over half of the Class of 2022 — completed our survey, which included questions about their blocking group name, leader, members, and size. Using these responses, we were able to identify 271 complete blocking groups, which account for 1,412 students, or 86% of the 1,641 freshmen listed in the Harvard College student directory. For all of the demographic variables we measured, we found that our data was very close to the results of a survey by The Crimson and data released by Harvard.
So what does our data show about how Harvard students form groups?
Large blocking groups are most common
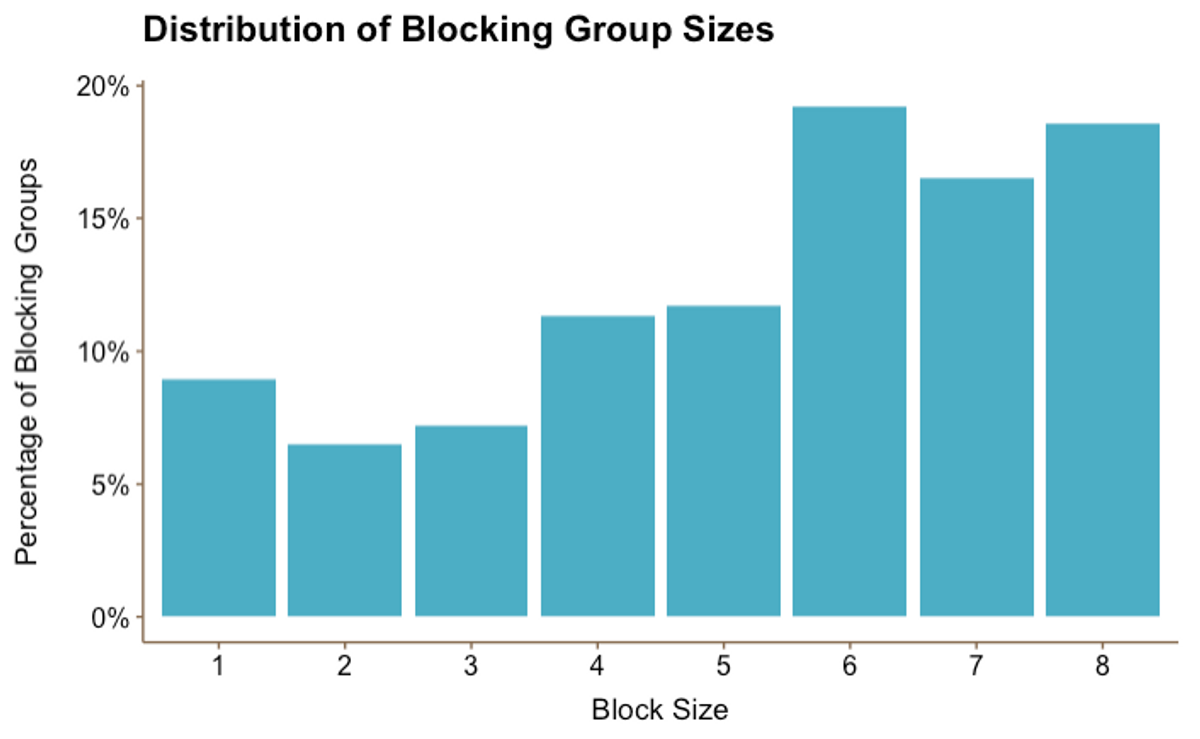 Figure 1
Figure 1 shows that the largest blocking group sizes (6, 7, and 8) are also the most common, representing over half of all groups (54%). Moreover, our data confirms the expectation that the vast majority of students choose to block in a group: while single person blocking groups comprised approximately 9% of our 271 groups, this represents approximately 25 freshmen — only 1.7% of all students in our sample.
Most blocking groups contain students from the same dorm and entryway
Out of blocking groups for which we know at least two people’s room numbers, entryways, or freshman dorms, we found that:
- 52% have at least 2 students who are roommates
- 60% have at least 2 students from the same entryway
- 64% have at least 2 students from the same dorm
It looks like students tend to block with people from their immediate community, particularly their freshman dorm and entryway. If a blocking group has at least two students from the same dorm/entryway, they are likely roommates. However, it’s essentially a coin flip whether there’ll be a pair of freshman roommates in any given blocking group. Unfortunately, this observation doesn’t tell us much about whether Harvard is good at selecting roommates for its freshmen. We’d need to compare our findings to those in a world where Harvard freshmen are randomly assigned roommates, but we don’t have this data. Moreover, it’s not clear that block rates are a good metric for evaluating roommate placements. Many students might get along with and like their roommates but simply do not become close enough friends to continue living together for the next three years.
Most groups don’t link
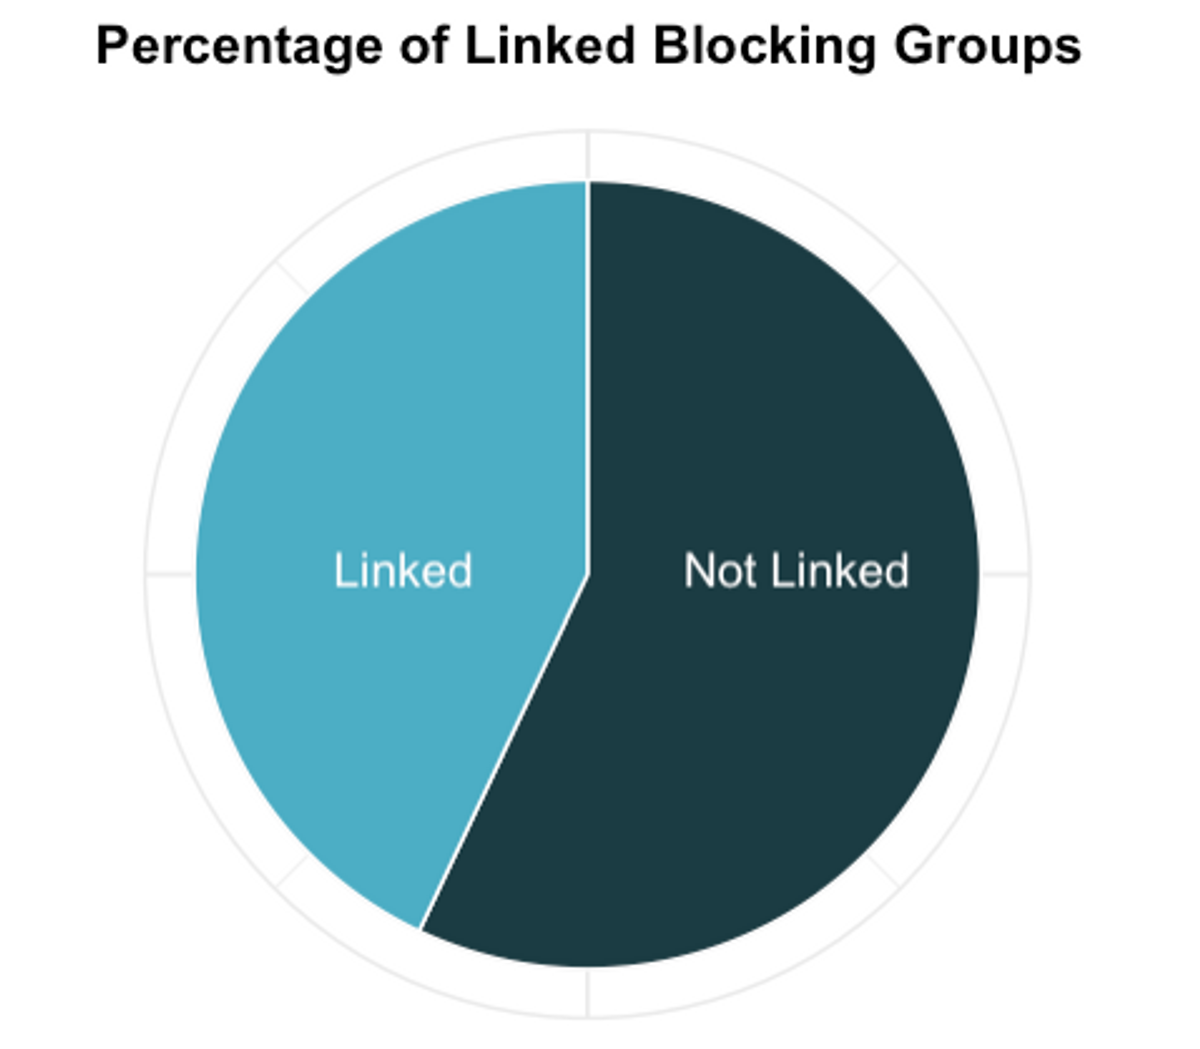 Figure 2
Figure 2 speaks for itself: fewer than half of blocking groups have a linking group (43%). Since most students want to live with their friends, this finding offers insight into students’ friend groups: the majority of Harvard students keep their main friend group relatively small — more specifically, up to eight students.
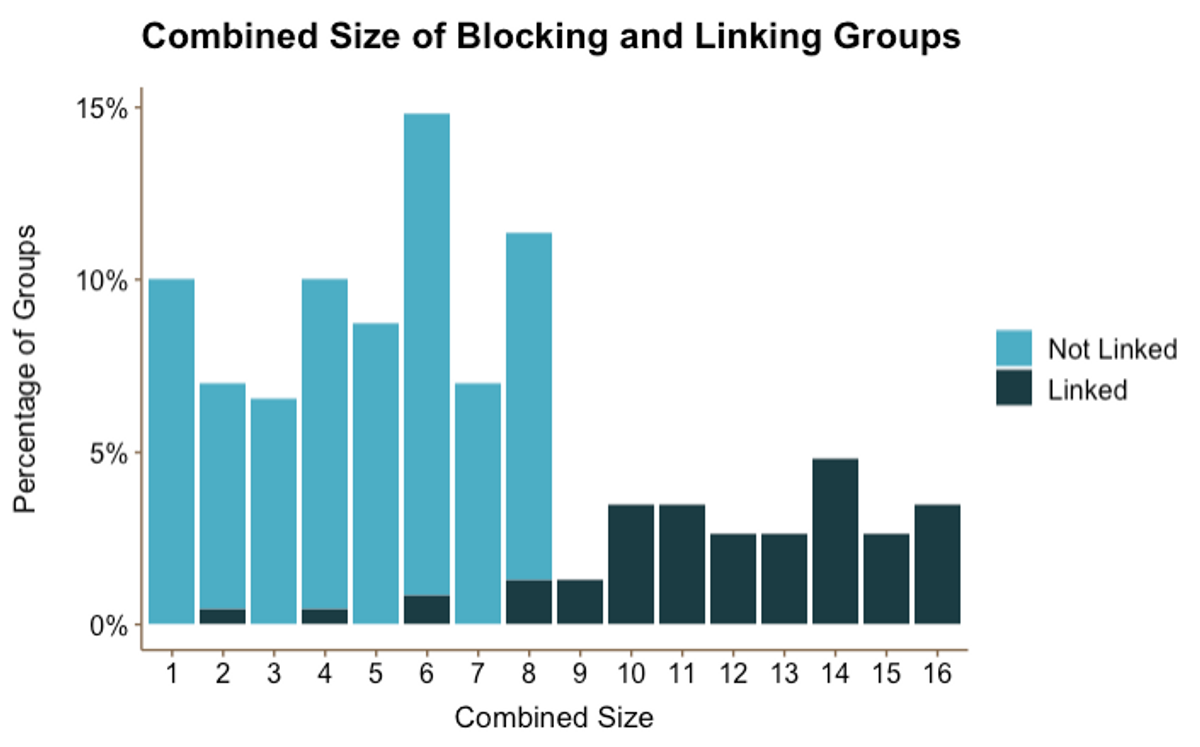 Figure 3
Figure 3 shows that a significant majority of groups have a combined size of 8 or less. It also shows the proportion of groups that linked (black) vs. those that did not link (blue): The groups with a combined size of 8 or less either did not link at all or linked very infrequently. In other words, Figure 3 further supports the conclusions that most blocking groups don’t link and most friend groups contain up to eight students.
Smaller blocking groups link less
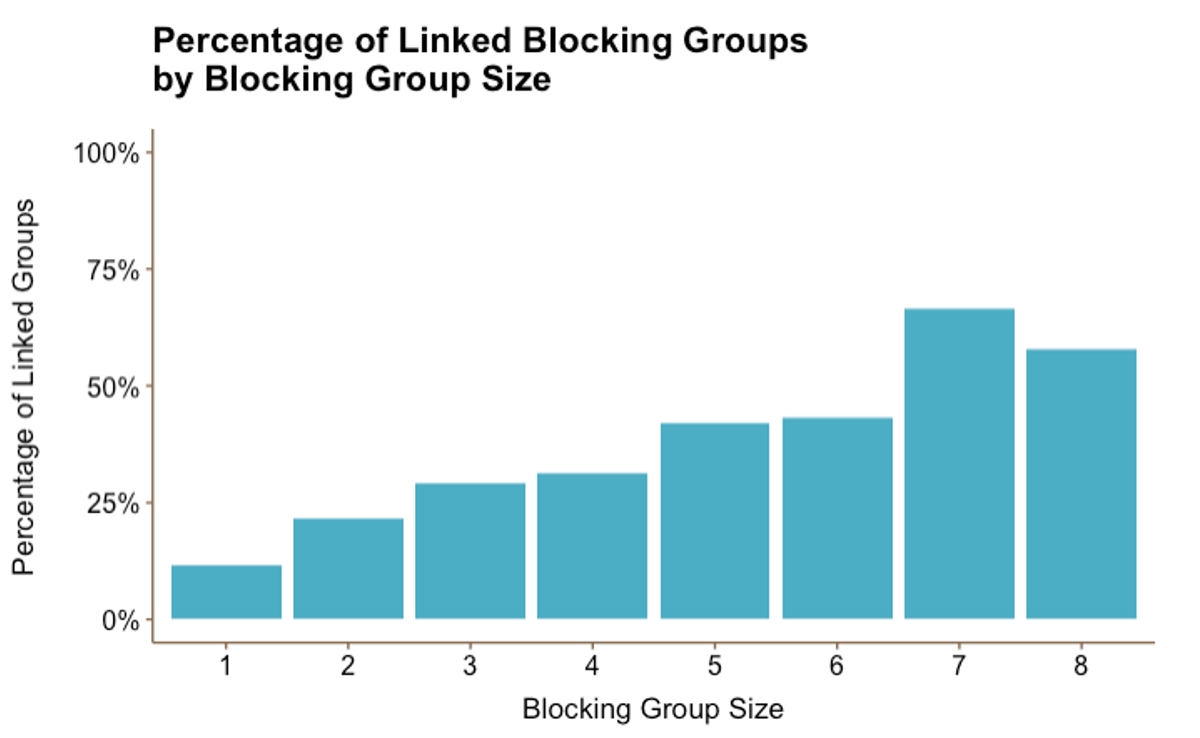 Figure 4
Figure 4 shows that as block size decreases, the proportion of groups that link decreases. Blocking groups of 7 and 8 had the highest link rates: 66% and 58% respectively. This makes sense since friend groups that are too large to block together often split into linked groups.
Some types of students self-sort
Do Harvard freshmen tend to choose students with whom they share a demographic feature (e.g., athletic status, legacy status, race, etc.) as blockmates?
In order to answer this question, we first had to define self-sorting, or what we called “clustering.” We decided to only consider non-single person blocking groups where we had data available about a given demographic feature for at least two thirds of its members. For example, a group of 8 students where 3 are legacies, 1 is not a legacy, and 4 are unknown would not be counted when testing whether legacies cluster. We defined a clustered group as one where at least two thirds of the “known” members share a given demographic feature. For instance, a blocking group consisting of 4 athletes, 2 non-athletes, and 2 “unknowns” would count as clustered since 4 of the 6 known members (i.e., two thirds) are athletes.
If we find that certain types of students seem to be forming groups amongst each other, the key question is whether they are clustering significantly more often than we would expect if groups were determined randomly. To demonstrate, assume 20 blocking groups in the Class of 2022 qualify as athletes clustering. If we randomly sort students into blocking groups many times, and most of these random samples result in far fewer than 20 clustered blocking groups, then it is likely that the observed grouping behaviour is not a fluke, but rather a pattern of deliberate self sorting.
We created a function that randomly sorted students into blocking groups using the actual group sizes. For each demographic feature, the function went through 10,000 iterations. Each time, it calculated the number of clustered groups. We plotted the frequency of the randomly generated number of clustered groups, and then we plotted the actual number of clustered groups on the same distribution. Note that the red line in each plot represents the actual number of clustered groups.
Athletes
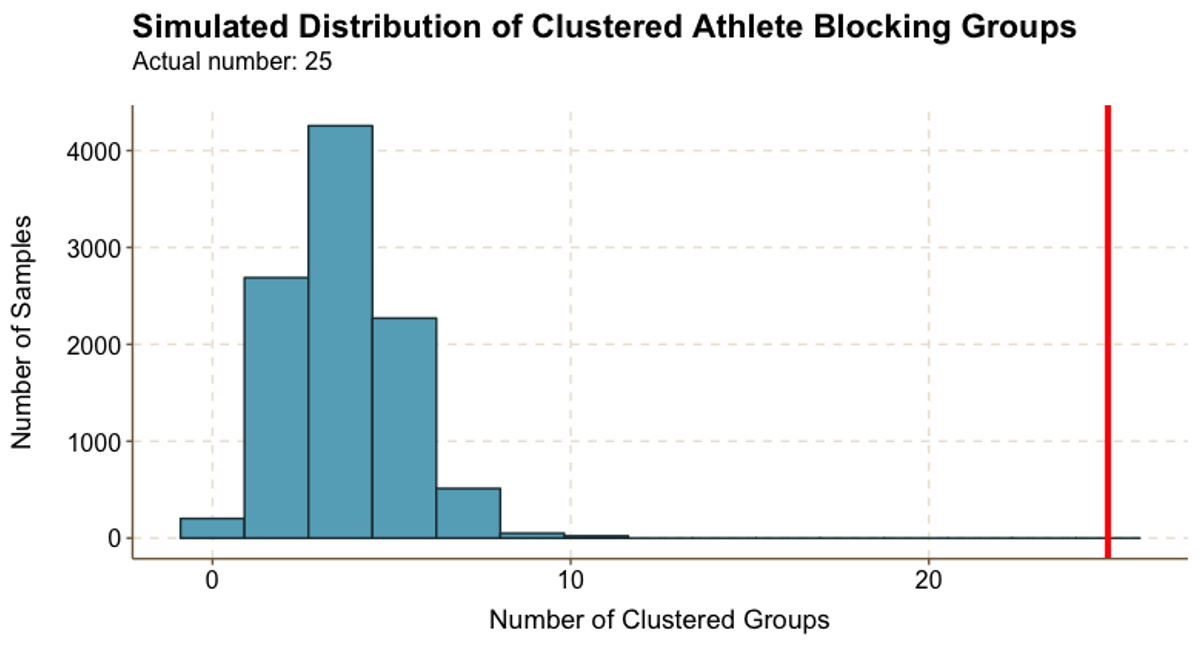 Figure 5.1
Athletes clearly self-sort. Figure 5.1 shows that there were 25 clustered groups in real life, whereas the vast majority of random samples resulted in fewer than 10 clustered groups. In fact, the largest randomly generated number of clustered groups was only 11.
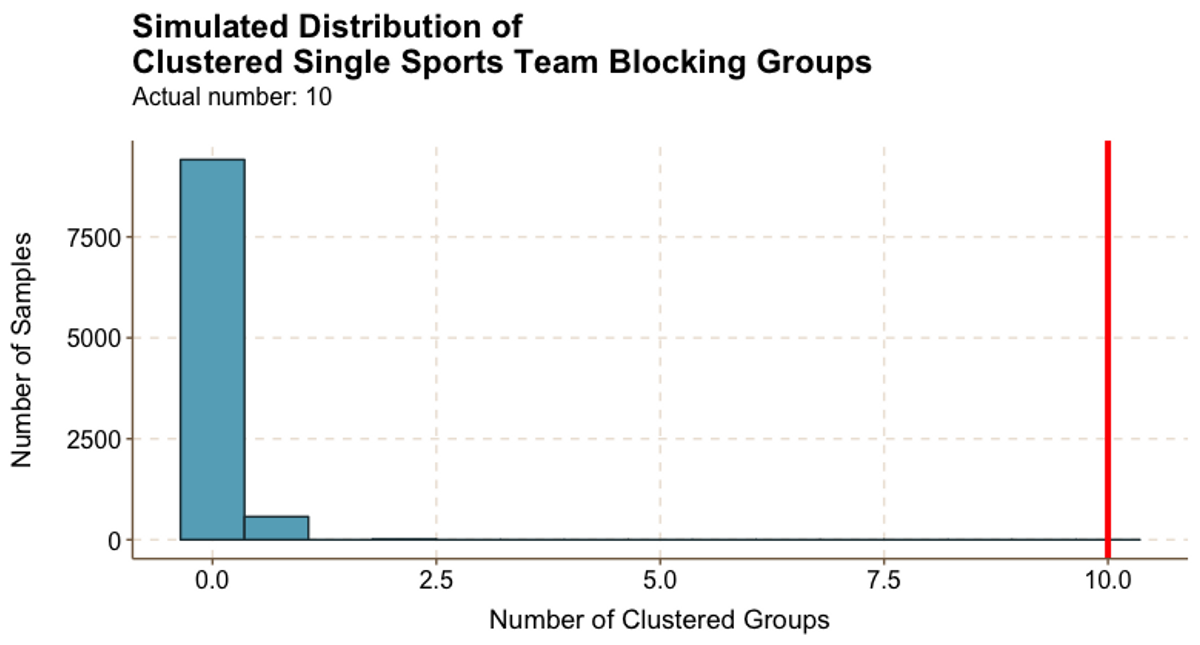 Figure 5.2
Athletes tend to block with teammates. Figure 5.2 shows that at least two thirds of 10 groups were composed of athletes from the same team. However, the vast majority of random samples resulted in 0 or 1 single-team clustered groups, and the largest randomly generated number of clustered groups was 2.
What were the athletic teams that clustered in real life?
- Men’s lacrosse (2 groups)
- Men’s football (2 groups)
- Men’s heavyweight crew
- Men’s swimming and diving
- Men’s track and field
- Men’s hockey
- Women’s volleyball
- Women’s lacrosse
It looks like male athletes are far more likely to self-sort than their female counterparts.
Legacies
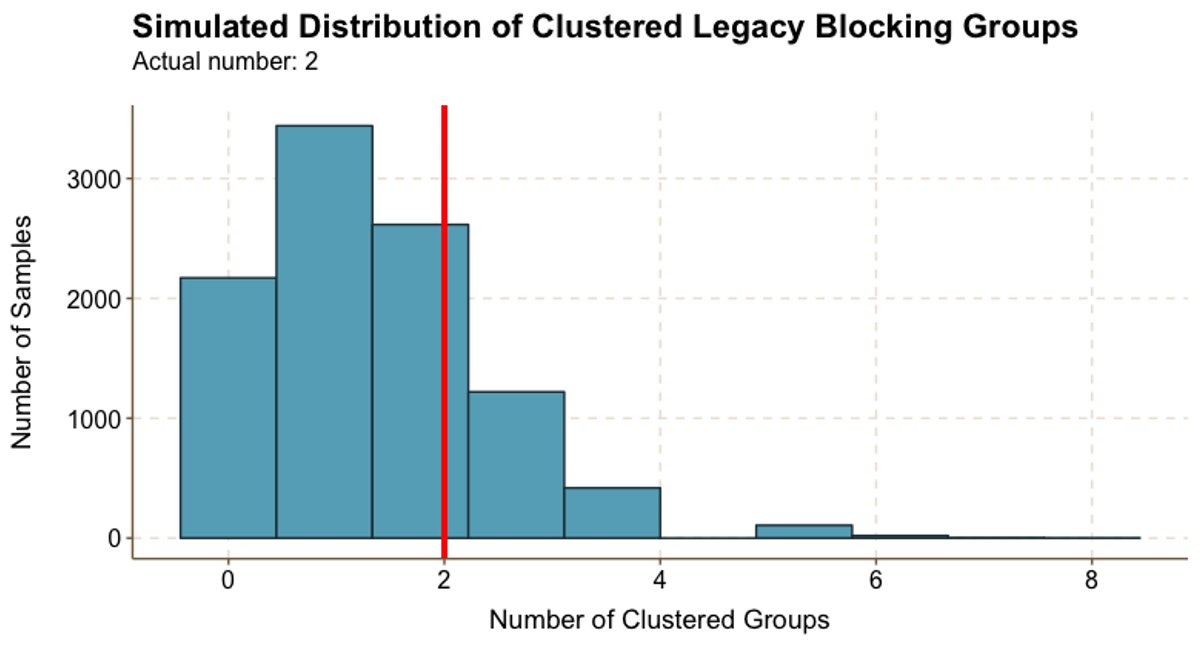 Figure 5.3
Our data does not show that legacy students self-sort. We could only identify two clustered legacy groups in the Class of 2022, while Figure 5.3 shows that over a quarter of the random samples resulted in two clustered groups, and a higher number of clustered groups occurred relatively frequently. It is important to note that our data may substantially underreport the true number of legacy students, which would skew these results.
Race
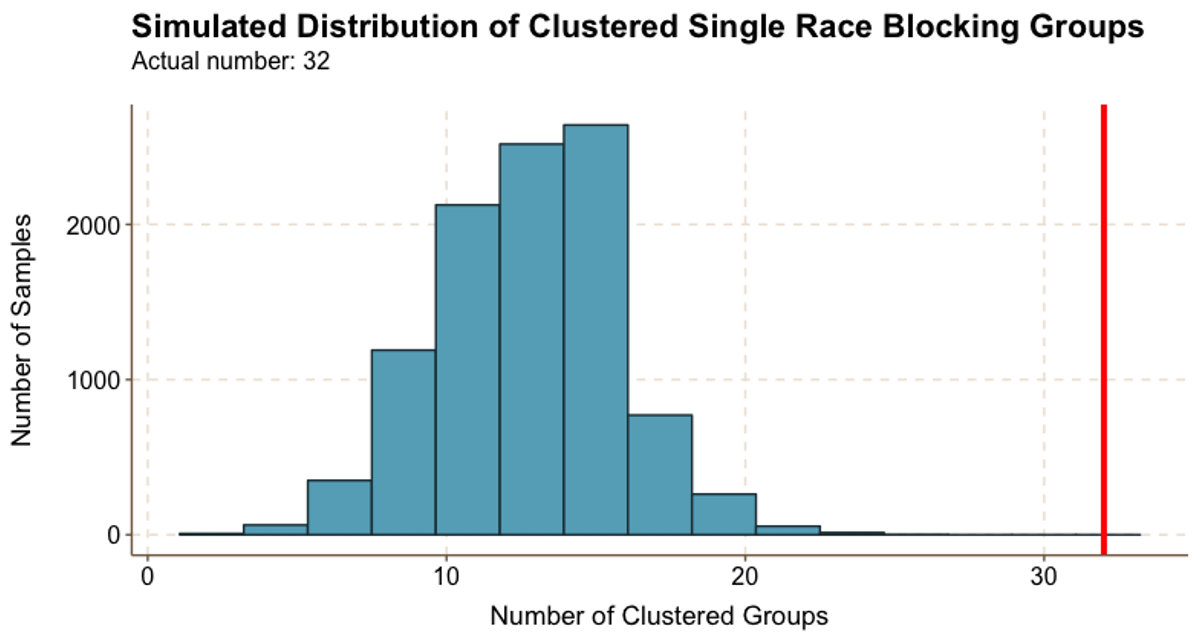 Figure 5.4
Our data indicates that Harvard students cluster by race: Figure 5.4 shows that we identified 32 clustered single-race groups, whereas the vast majority of random samples resulted in fewer than 20 clustered groups. In fact, the true number of clustered single-race groups is likely even higher than the 32 we identified because our results are limited by missing data: we only have racial data on half of the Class of 2022, and we could only consider groups where we know the race of at least two thirds of the group members.
Financial aid
Interestingly, it looks like students receiving financial aid do not self-sort, but students who are not financial aid recipients do.
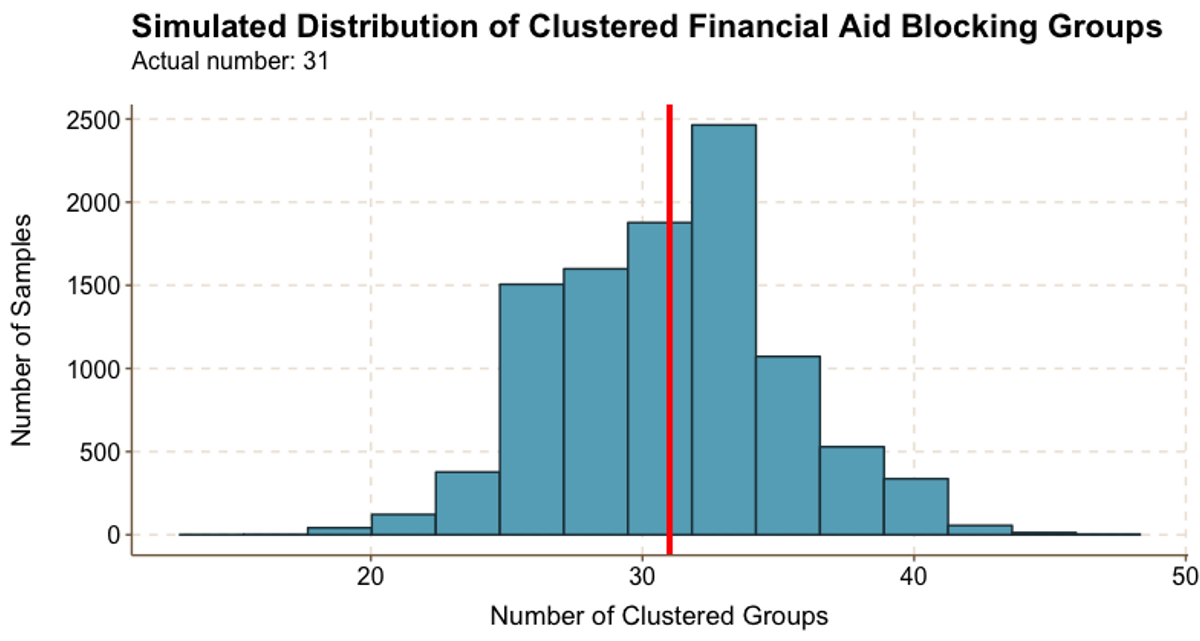 Figure 5.5
Figure 5.5 shows that we identified 31 clustered groups of financial aid recipients, and the randomly generated samples resulted in many instances of 31 clustered groups. In fact, the most common number of randomly generated clustered groups was even higher than 31.
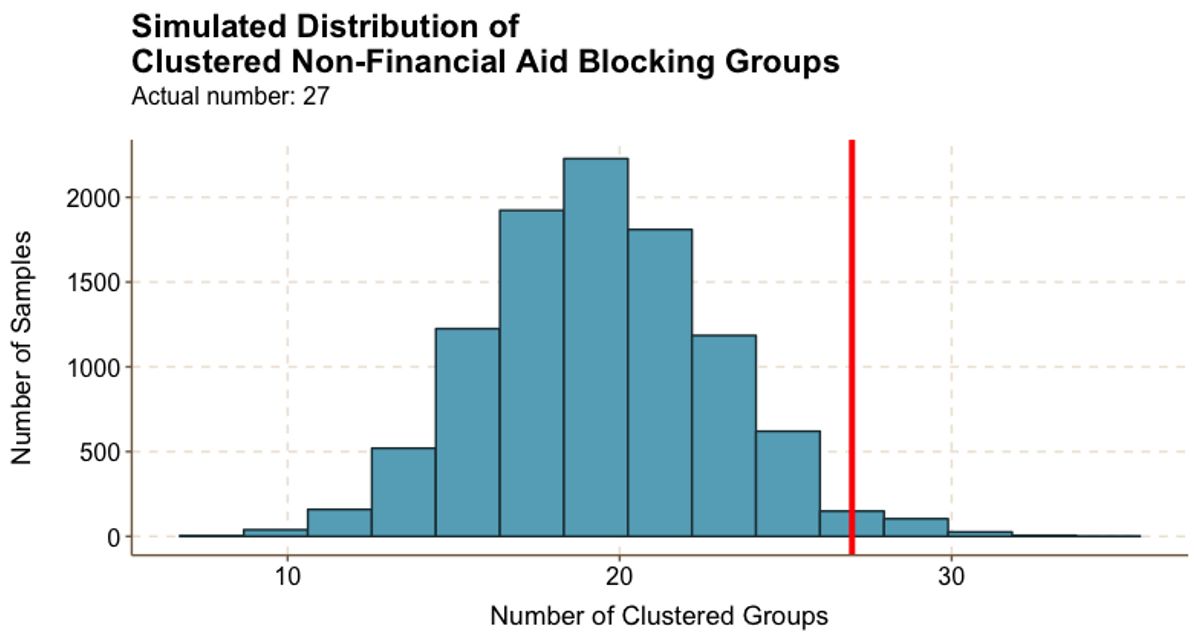 Figure 5.6
In contrast, while we were able to identify fewer clustered non-financial aid groups (only 27), Figure 5.6 shows that very few random samples had a result close to the actual number of clustered groups.
International students
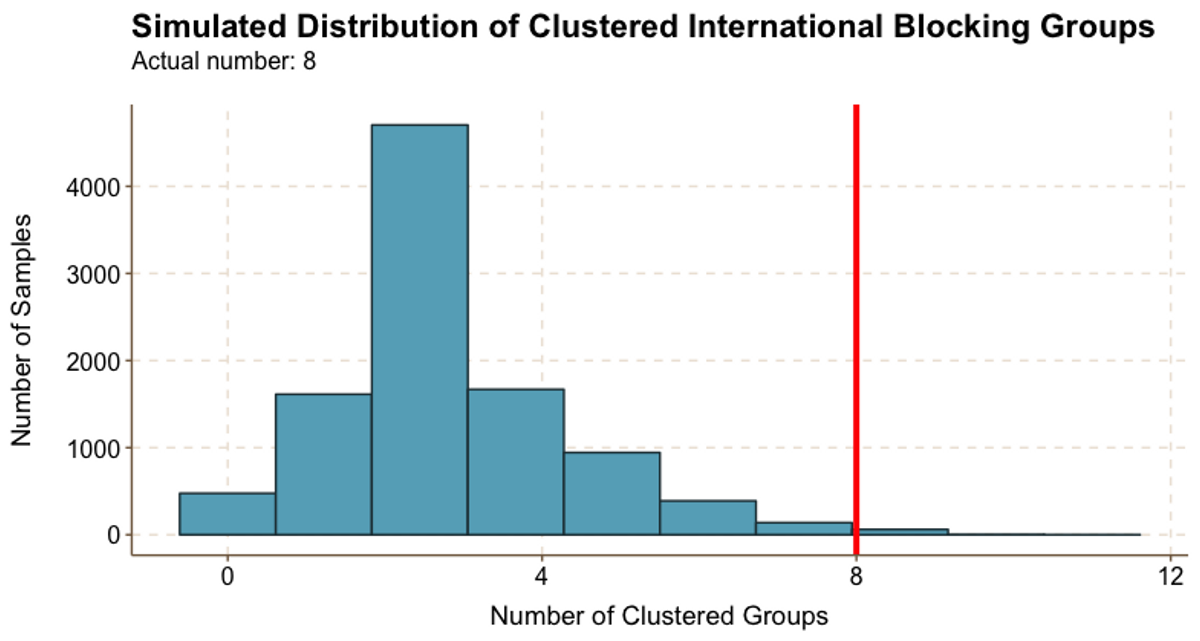 Figure 5.7
Finally, it looks like international students also self sort. We identified 8 clustered international groups; as demonstrated in Figure 5.7, while some random samples resulted in 8 clustered groups, this was a very rare result.
Conclusion
In analyzing our data on freshmen’s blocking choices, here’s what we’ve learned about how Harvard students form groups:
- Most friend groups are relatively small: 6 to 8 students
- Students tend to befriend those in their immediate community, particularly their dorm and entryway
- The larger a group, the more likely it is to link with another group
- Athletes, students not receiving financial aid, international students, and students of the same race tend to self-sort
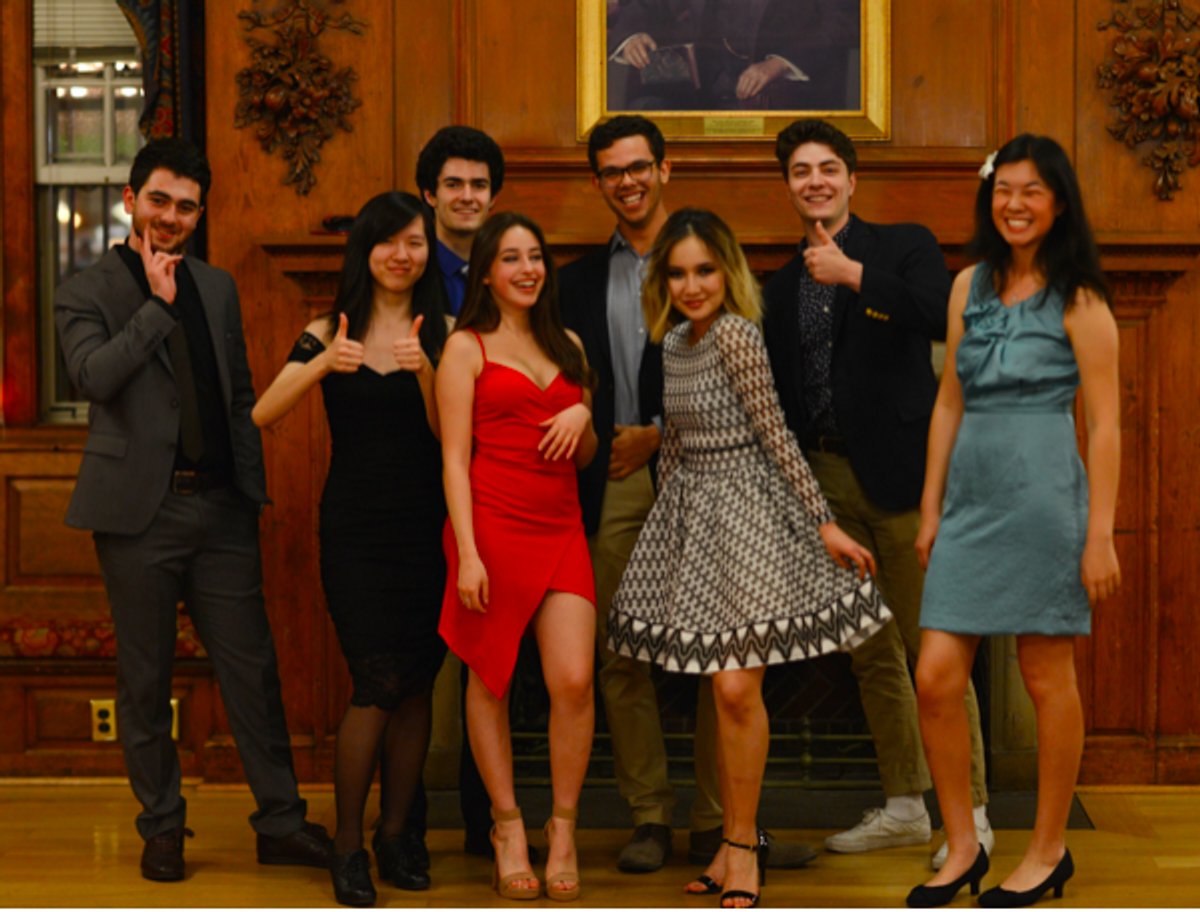 The team that worked on this project. Back, from left to right: Ilkin Bayramli (‘22), Christopher Milne (‘22), Alistair Gluck (‘22), Niel Schrage (‘22). Front, from left to right: Stephanie Yao (‘22), Dasha Metropolitansky (‘22), Adiya Abdilkhay (‘22), April Chen (‘22).