
It is no secret that Harvard is a well-funded institution, and its professors are well-paid. While salaries of the highest paid faculty and staff at Harvard are listed in public tax filings, the compensation for the vast majority of Harvard faculty is not publicly available. In this article, I attempt to proxy the wealth of Harvard faculty using publicly available Massachusetts property records. I then use the housing values of professors to compare the wealth of tenured and non-tenured faculty, as well as across different academic disciplines.
I find that
I also find that tenured faculty are significantly more likely to have a housing record and have a significantly higher average house value than non-tenured faculty. There are also noticeable differences between departments in terms of distance to campus, but there is no such difference between tenured and non-tenured faculty. I also find no statistically significant relationship between academic influence, as measured by faculty’s h-indices, and housing value, but a significant positive correlation between academic influence and distance to Harvard.
The methodology for obtaining the data is provided at the end of the article.
Basic Analysis
In total, the dataset consists of 259 confirmed housing records out of 631 total professors in the Faculty of Arts and Sciences (FAS), which represents about 40%. The data may be missing for a variety of reasons, including an inability to confirm the professor’s occupancy in a property based on the available tools, or because some faculty may prefer to rent rather than own property.
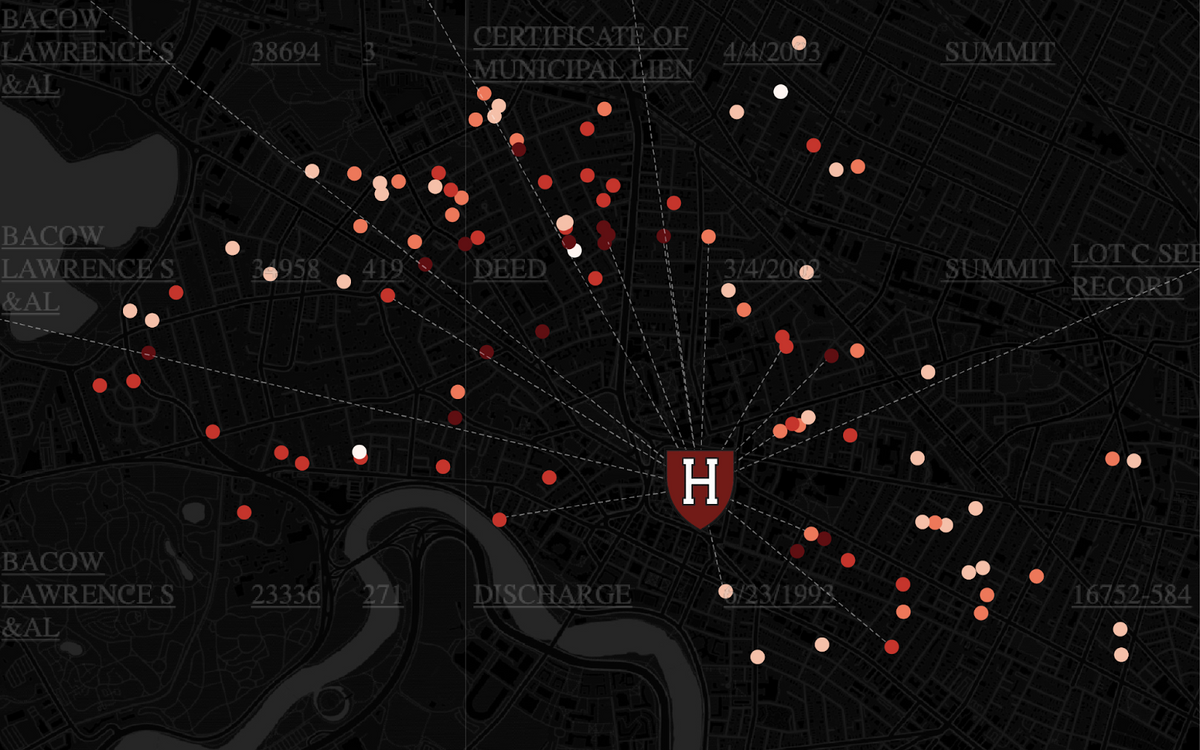
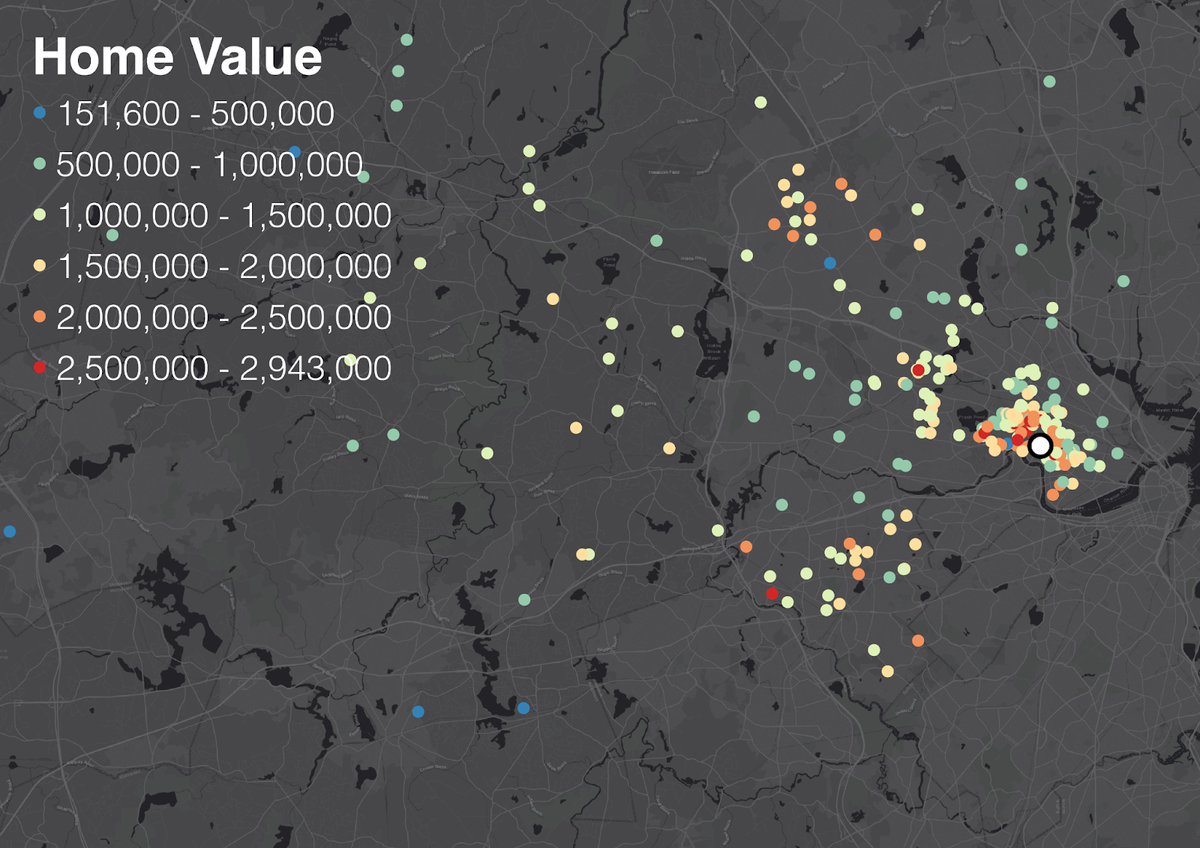
The value of the average professor’s home was $1.4 million (median is $~1.3 million), about 55% higher than the average home value in Cambridge, MA, which is estimated to be around $900,000. The average distance between a professor’s house and the Harvard Science Center is 4.75 miles. The map below shows the location of Harvard faculty homes along with their corresponding prices. The large white dot represents Harvard University.
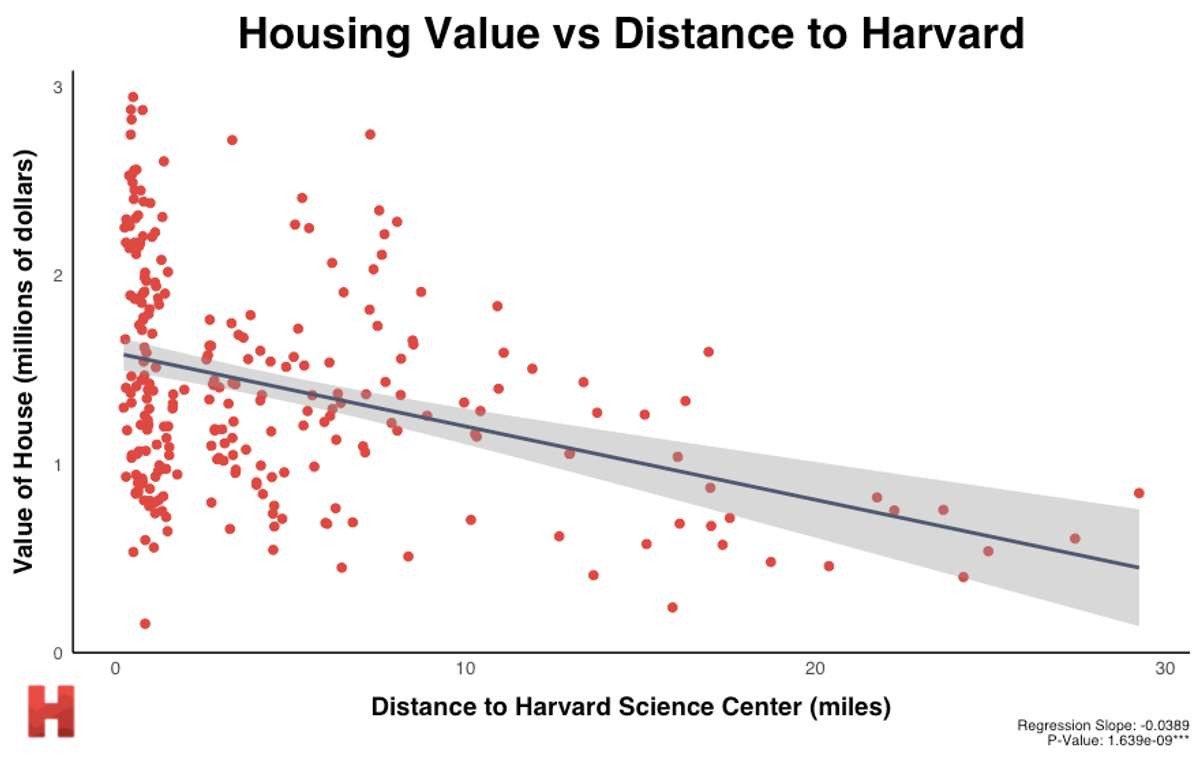
The relationship between the distance to Harvard and the value of a faculty member’s house is plotted below. There is a highly statistically significant negative relationship between the distance to Harvard and the value of a professor’s house.
Comparison of Departments
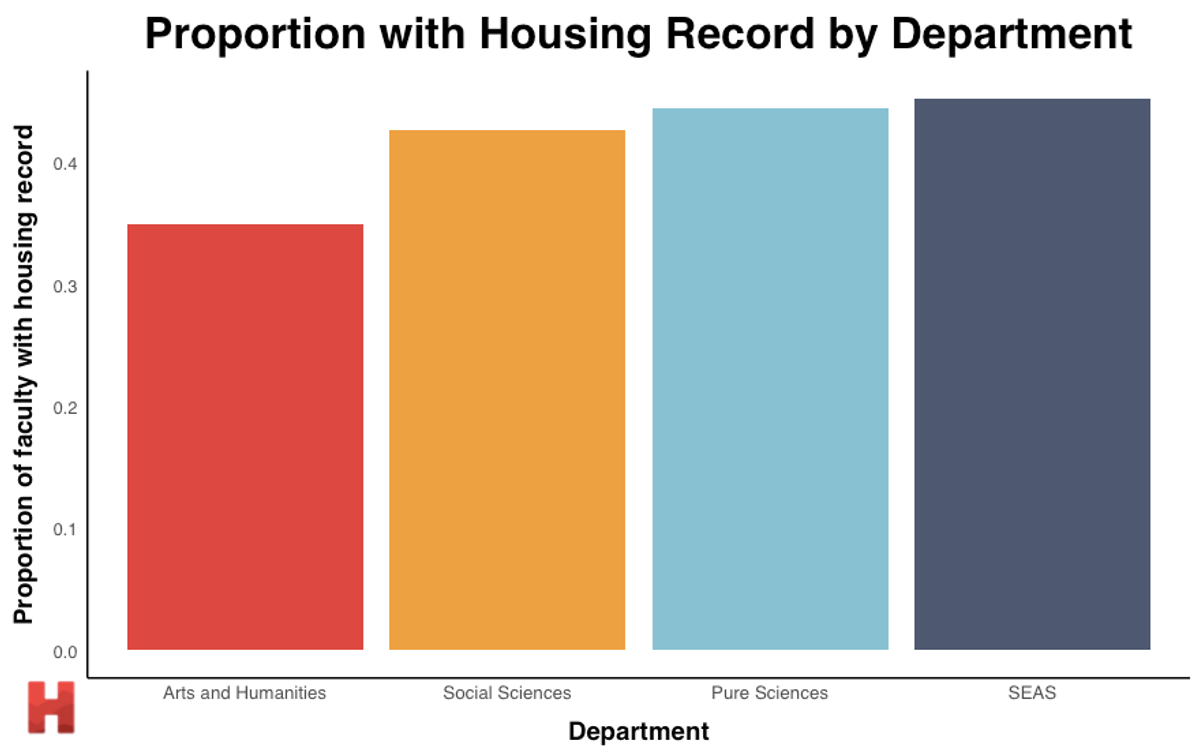
Because of the large number of academic departments at Harvard, I aggregate the academic departments into four broad categories following Harvard’s classification of undergraduate concentrations: Arts and Humanities, Social Sciences, Pure Sciences, and School of Engineering and Applied Sciences (SEAS). Among the four departments, SEAS has the highest proportion of confirmed housing records, while the Arts and Humanities have the lowest proportion. This may be indicative of the ownership vs. renting division between different departments.
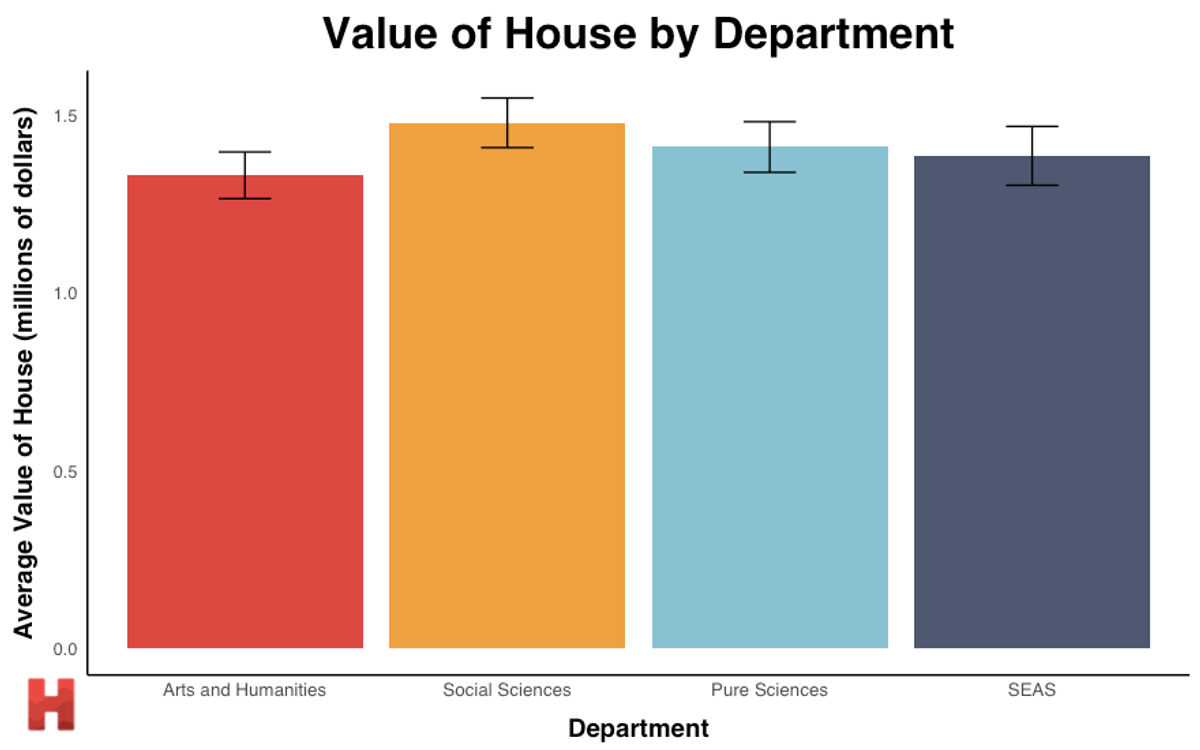
The average housing value by academic department is displayed in the below plot. These largely conform to “folk” expectations, with Social Sciences having the highest housing values and Arts and Humanities having the lowest.
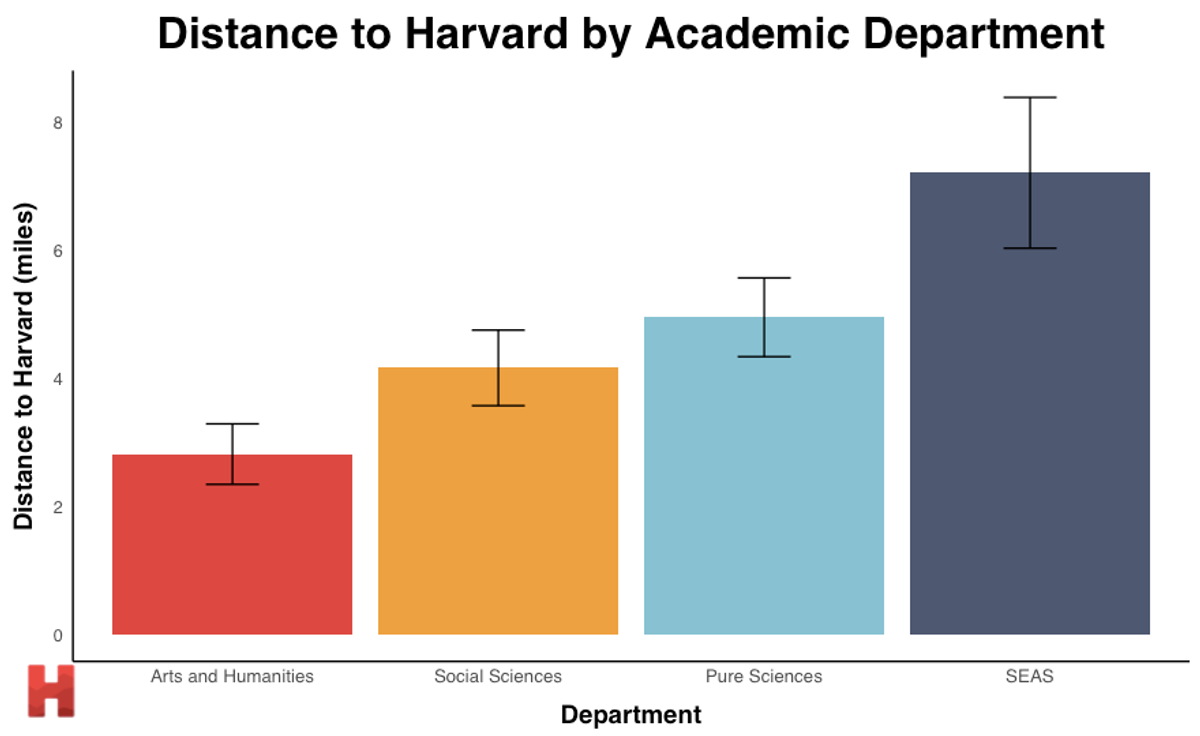
However, there is a far greater difference in the average distance of each department’s house to the Harvard Science Center as shown in the plot below.
Part of this may be due to the choice of the Science Center as the point of comparison, and with the new SEAS offices in Allston, it may be that SEAS faculty prefer to live closer to Allston.
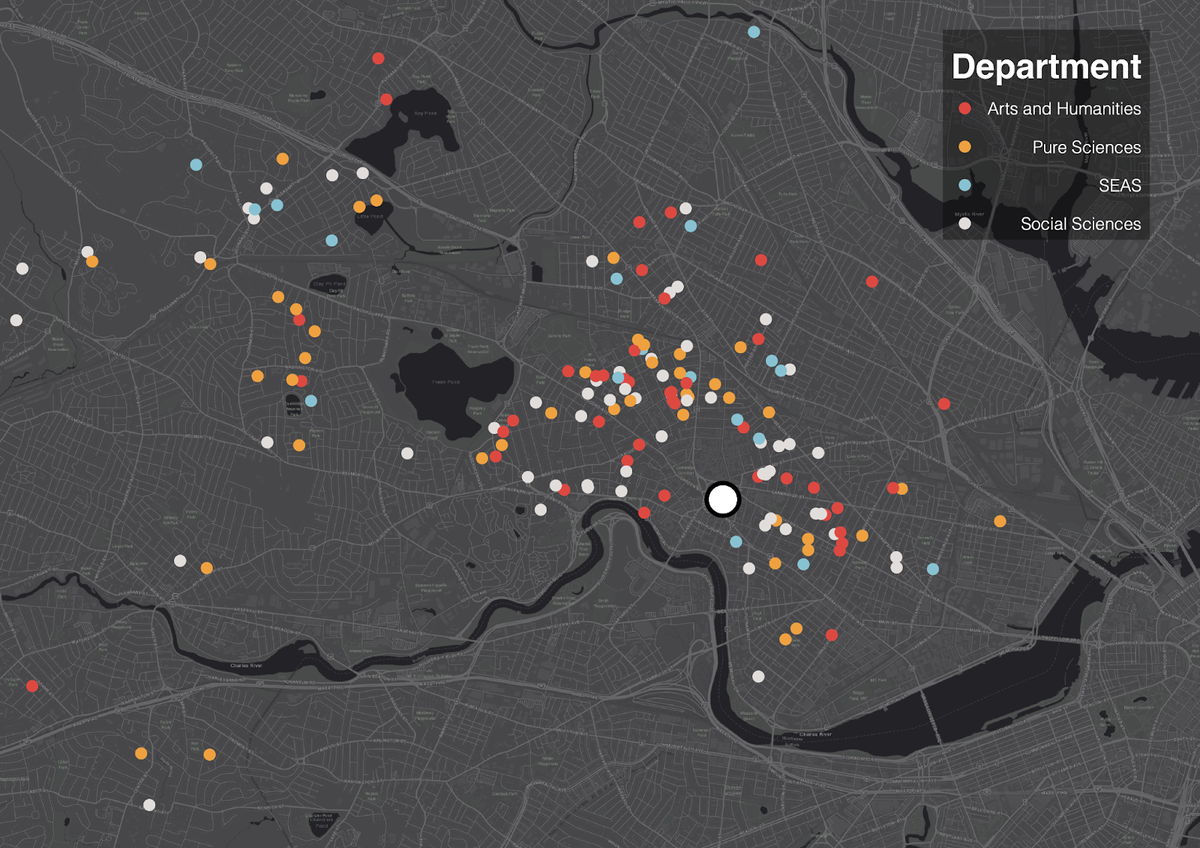
The map below shows the general distribution of faculty locations around Harvard colored by their department. There is no obvious pattern based on the map, but there does seem to be some evidence of faculty clustering together generally.
Tenured vs. Non-Tenured Faculty
I classify non-tenured faculty as any faculty member with “Associate,” “Assistant,” or “of the Practice” in their title. This resulted in 457 tenured faculty (72%) and 174 non-tenured faculty (28%). Among tenured faculty, 219 (49%) had a housing record, while only 40 (23%) of non-tenured faculty had a confirmed housing record. This difference is to be expected, as non-tenured faculty would likely prefer to rent rather than buy houses if their employment status is more volatile and if their income is lower.
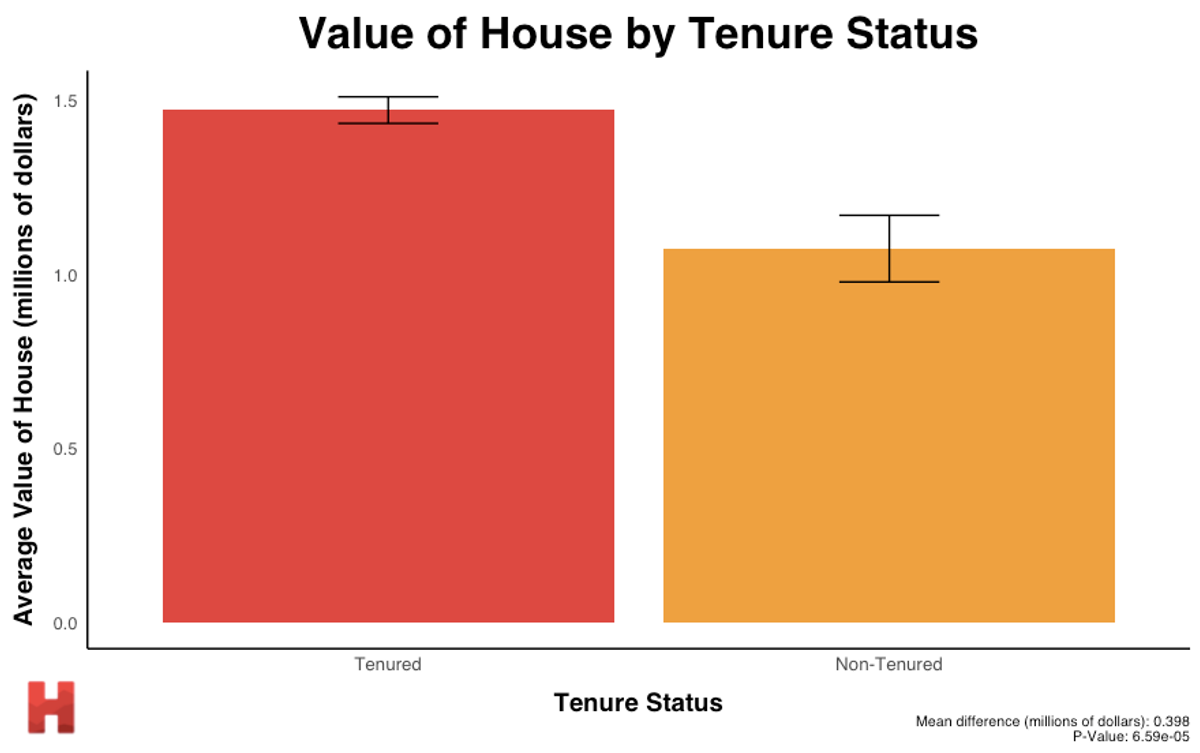
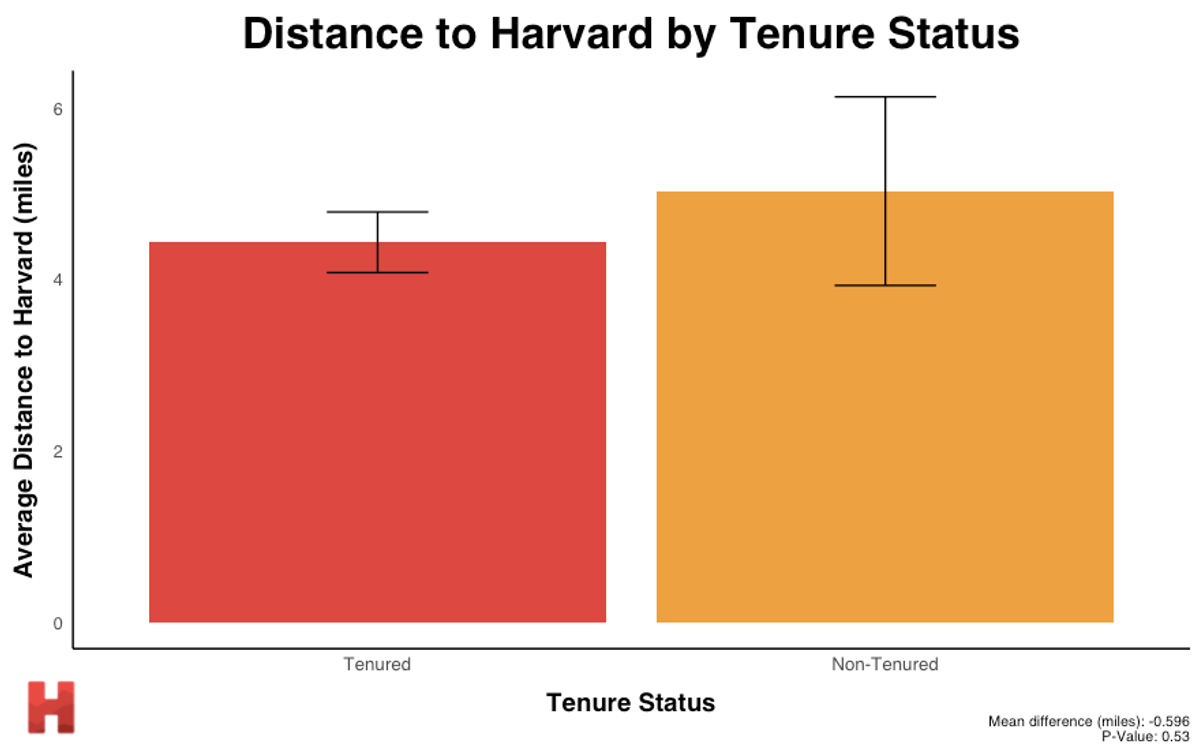
While there is a clear difference in the value of the housing, the distance to Harvard is not statistically significant. Part of the reason for this may be a tradeoff, where living farther from Harvard results in lower housing costs but involves higher transportation costs. Consequently, while the lower cost of living results in non-tenured faculty living slightly farther away from Harvard, the difference is not large enough to be statistically significant.
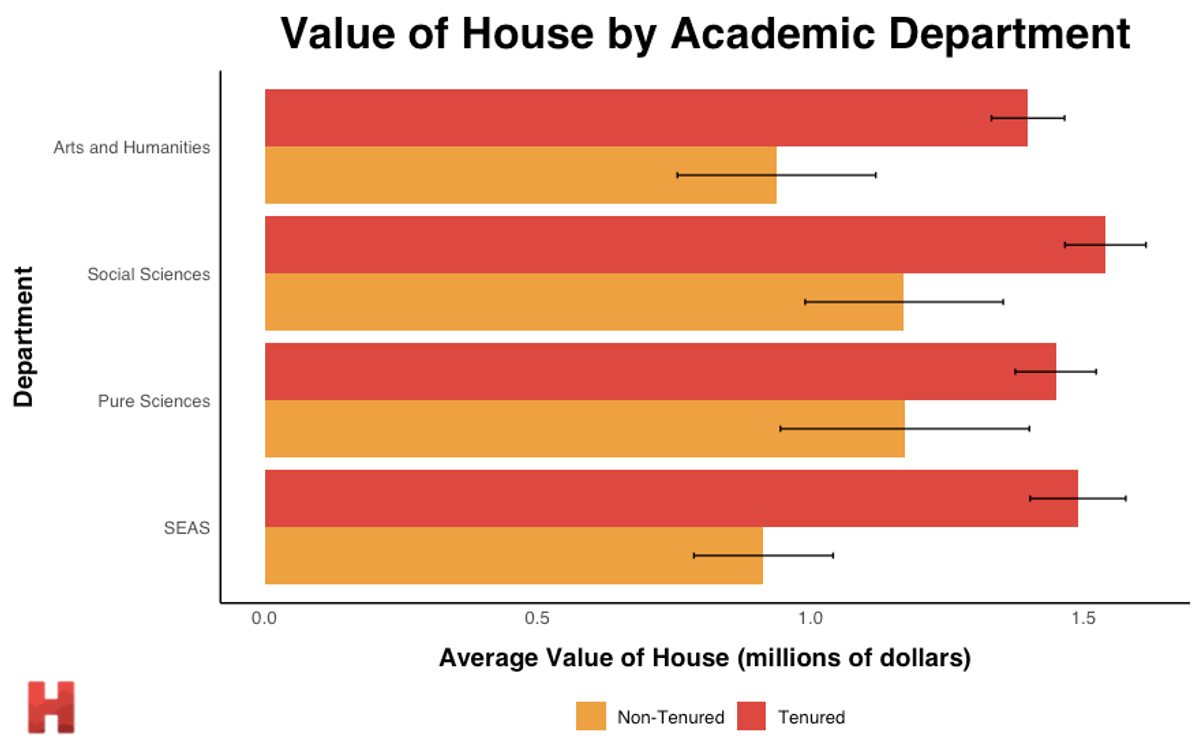
Finally, we can compare the differences in tenured and non-tenured faculty across departments. Of particular note is that SEAS has a large difference between the housing values of their tenured and non-tenured faculty. SEAS has the lowest average housing value among non-tenured faculty, while the second highest average housing value among tenured faculty. Notably, the Arts and Humanities have the lowest housing values among tenured faculty and the second lowest among non-tenured faculty.
Academic Influence
The final piece of analysis I consider is the relationship between a professor’s housing and their academic influence. I use a professor’s h-index as their main measure of academic influence. While there are valid criticisms of h-index as a reliable measure, it is sufficient for the purposes of this analysis.
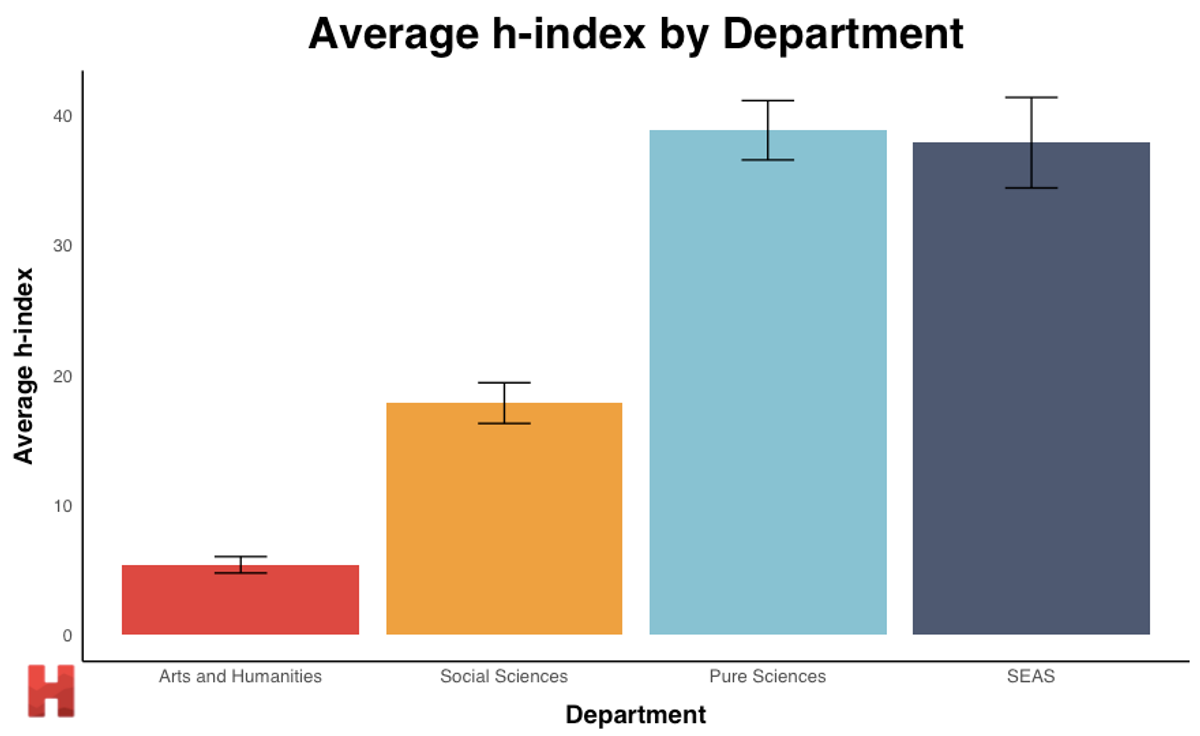
I first conduct some basic comparisons of h-index between departments and between tenured and non-tenured faculty. The below plot shows considerable differences in h-index between academic departments, likely due to different publishing and citation norms in different academic fields.
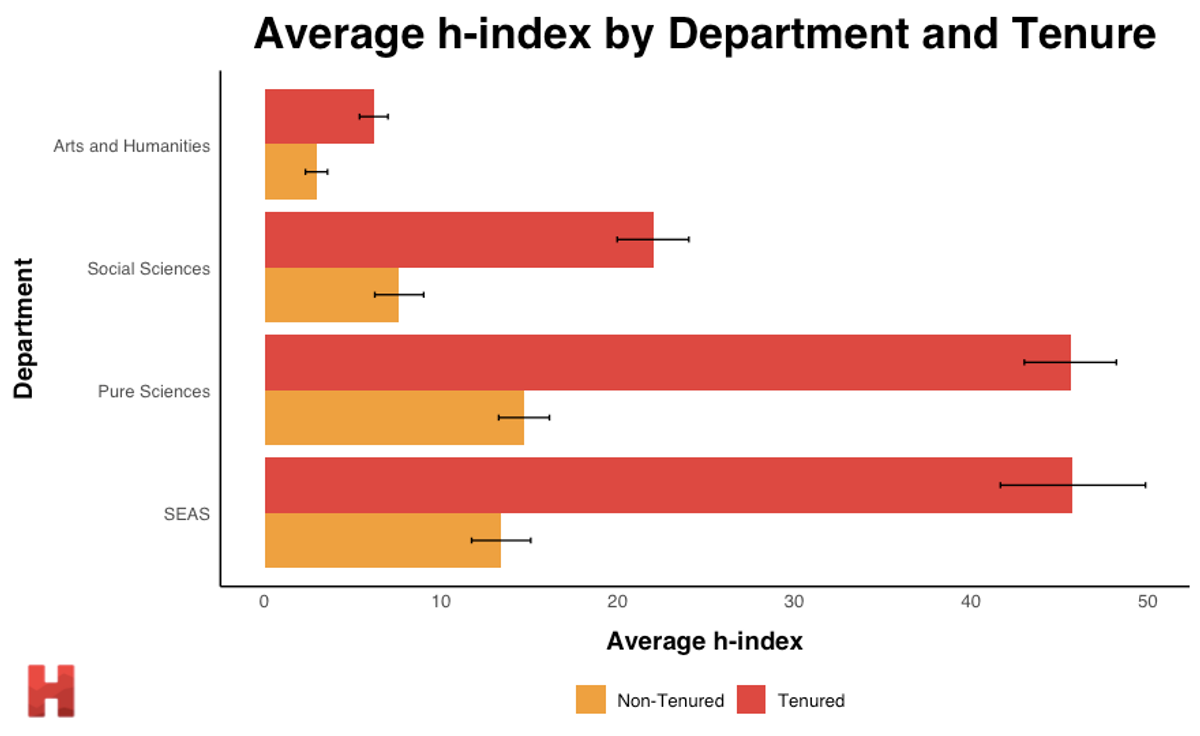
As expected, there are also large differences in average h-index between tenured and non-tenured faculty within each department.
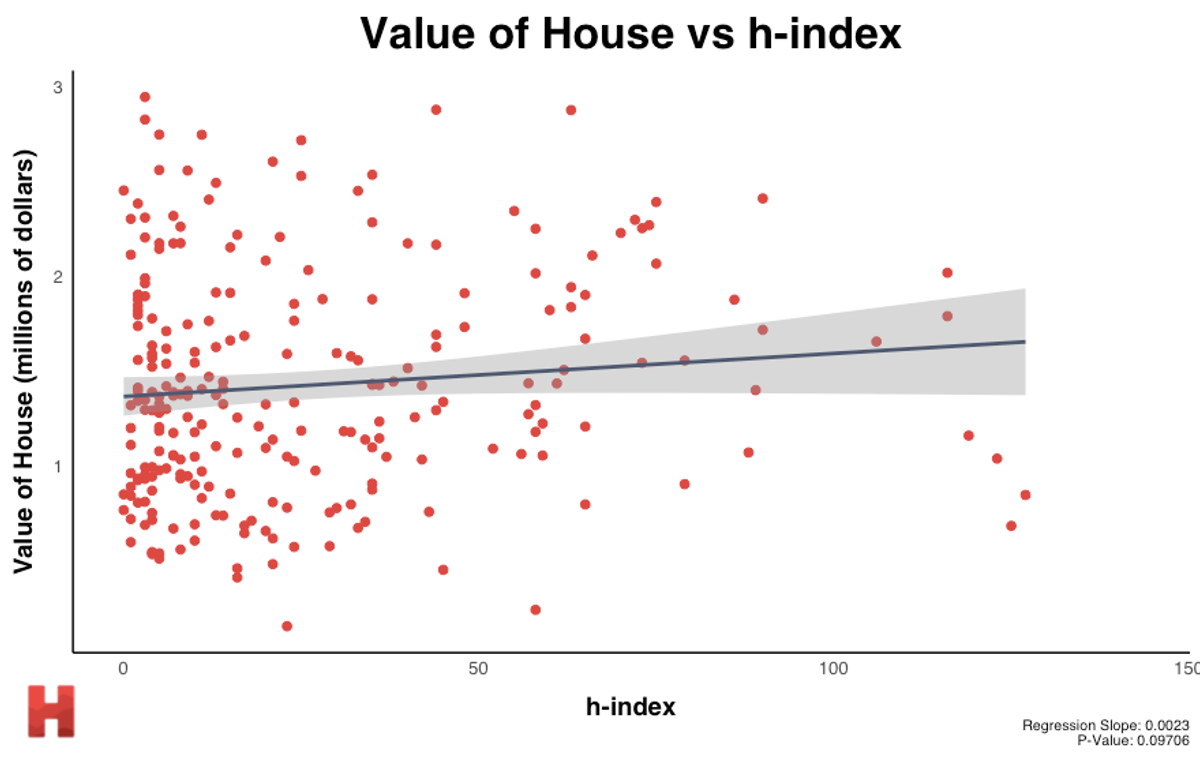
However, the correlation between h-index and home value is less clear. While there is a positive correlation as one would expect, the relationship is not statistically significant. The relationship becomes even less statistically significant after controlling for department and tenure status.
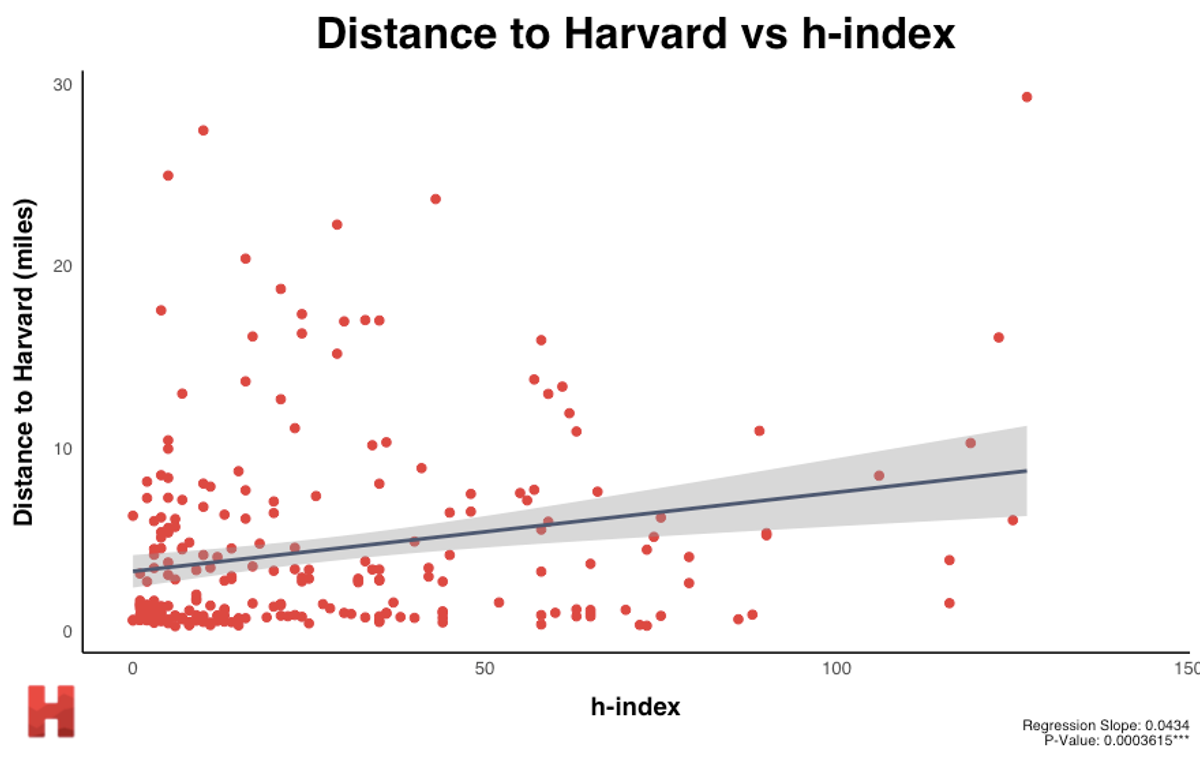
Interestingly, there is a statistically significant positive correlation between h-index and the distance to Harvard.
After controlling for both department and tenure, the significance of the relationship decreases, but remains significant at the 0.10 level.
Limitations
There are a number of limitations in terms of the data quality and the conclusions that can be drawn from this analysis.
Perhaps the most significant limitation is in terms of the data. Most of the data was manually collected and I attempted to validate them as best as I could, but there are likely some mistakes in the dataset itself. While it is unlikely that such errors would bias the results in any particular direction, they may nonetheless weaken the conviction with which we can make conclusions. The dataset also only includes faculty that currently own property in North and South Middlesex County, and entirely omits faculty that may be renters.
We should also be careful about the conclusions drawn from the analysis. Because wealth and income data for faculty are not public, I use property values to proxy for these variables. However, property values offer an imperfect proxy. It may be that professors in some departments simply have different preferences over housing consumption than other departments. If, hypothetically speaking, Arts and Humanities faculty donated a greater share of their income than Social Sciences faculty, this may result in Social Sciences faculty having higher property values even if incomes are the same.
Furthermore, faculty members may not be the primary income earners in their household that drives their housing purchases. If, for example, Social Sciences faculty are more likely to interact with and marry wealthy financiers, then this may result in an upward bias of their home values compared to other academic departments.
Methodology
This data was gathered starting in Fall 2019, which may result in some of the data no longer being applicable.
I compiled a list of faculty using the Harvard Faculty Finder, which has since been replaced by Harvard Link. While this provided the names of most faculty, it often did not include the school the faculty was associated with, the title of the faculty, or the department they were affiliated with. I filled in these gaps by conducting manual searches using the public Harvard Web Directory. While the complete dataset here provided data on faculty from every Harvard school, the remainder of this analysis was restricted to members of FAS with “Professor” in their title to make the data gathering process tractable. Importantly, the analysis omits University Professors, as they are technically not members of FAS.
To obtain property records for each FAS faculty member, I conducted searches for the names of faculty members in North and South Middlesex County via the Massachusetts Land Records website. Each case where the faculty member in question was the grantee of a land deed was recorded in the dataset.
I used a variety of methods to verify the identity of the property holder was indeed the corresponding Harvard faculty member. If there were two grantees listed on the deed, I googled to check whether the other grantee was a spouse of the Harvard faculty member. I also cross-checked with faculty members’ public CVs to ensure they were at Harvard when the deed was granted.
To omit previous property holdings and limit to current occupancy, I used Melissa.com to search for each property a professor had once held and verify that they were the current occupants of that property. I used the same website to obtain estimates of the property value of each professor. I restrict the analysis to use only properties where the current occupancy of that property was verified. If there were multiple such properties, I used the highest valued property as the representative property for each faculty member.
Finally, to calculate the distance between a professor’s house to the university, I used the Google Maps API to reverse geocode professors’ addresses into coordinates, then used GeoPy to calculate the geodesic distance between the professor’s house to the Harvard Science Center.
Privacy concerns and replicating results
While the Harvard College Open Data Project typically strives to make the data used in such analyses public, I have chosen not to do so in this case because of privacy concerns related to publicizing the addresses and home values of specific faculty members. Although the data for this analysis was gathered entirely from public sources, it seems imprudent to make such data easily available to the general public. However, the public nature of the data means that the results from this analysis should be entirely replicable.
If there are specific subsets of the data that you wish to request, please email harvardopendataproject@gmail.com.