
Effect of COVID-19 on Harvard Square Restaurants
How are businesses faring and adapting?
In January of 2020, the World Health Organization (WHO) began requesting information from China about novel coronavirus cases. Two months later, President Trump declared a national emergency, and colleges across the U.S., including Harvard, decided to send their students home for online schooling. Beyond education, COVID-19 has touched all aspects of our lives, including how we dine.
In the following article, the critical question we will attempt to answer is the extent of COVID’s impact on Harvard Square restaurants. This analysis can be broken down into multiple components, comparing pre-COVID and post-COVID quantity of reviews, transaction methods (delivery vs takeout vs dine-in), restaurant price, and reviewer location.
The following information may be relevant to businesses in college-towns, especially in Cambridge, where international and domestic tourism along with the student body occupy a sizable portion of their customer base. As business slowly rebuilds itself near the end of COVID-19, we hope that this data can help future, broader research projects, support local businesses in adapting to crises, and provide insight to Harvard students curious about how their favorite restaurants have been faring.
The Data and Our Methods
Restaurant reviews and their dates were collected from TripAdvisor and Yelp, for a total of 46 different restaurants including classics like Felipe’s, Hong Kong, and Zinneken’s. Since TripAdvisor is a travel platform used mainly by tourists, we decided to focus on its data regarding user location (domestic or international) for analyzing tourism activity. On the other hand, we used Yelp for obtaining more general information: price, transaction methods, and the number of total reviews. All data was collected using web scrapers built with Python.
The Insights
Are there still tourists at Harvard?
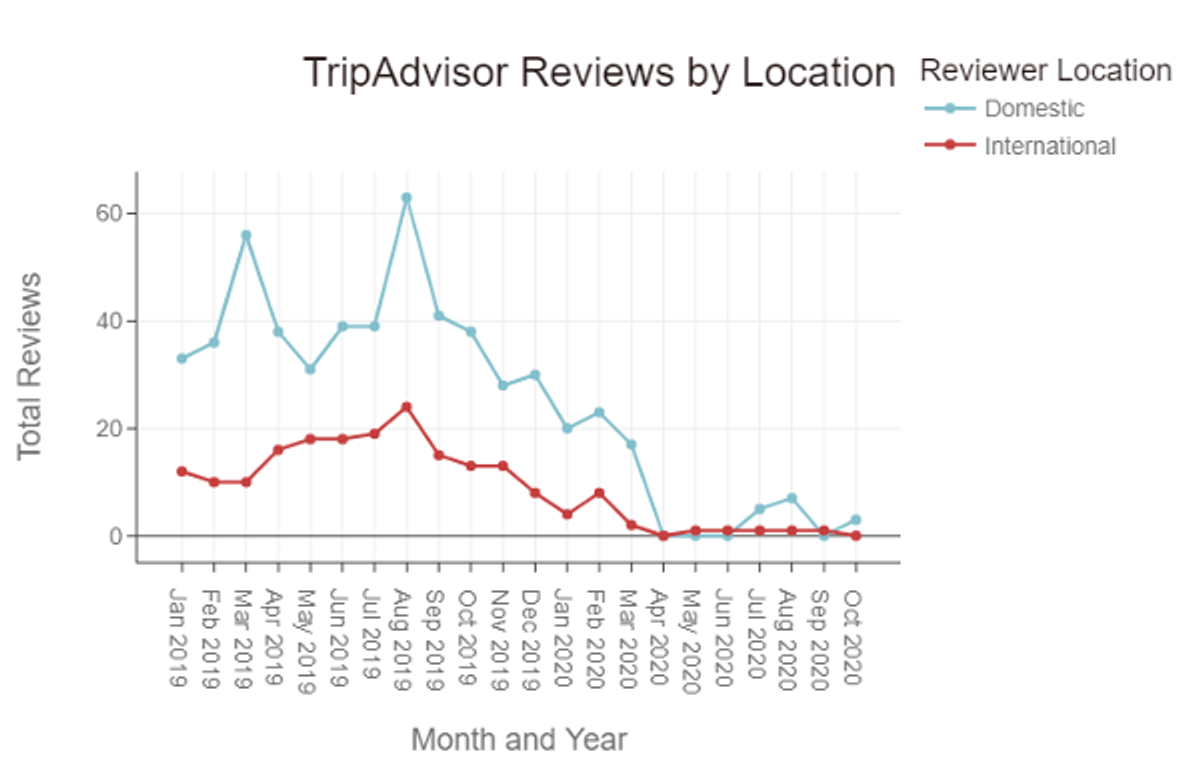
The graph above shows the decrease in total reviews on TripAdvisor from all 46 restaurants for both domestic and international consumers, indicating a decrease in consumers and revenue.
There are several other key takeaways from this graph:
- There are less international reviews than domestic reviews.
- Pre-COVID domestic review fluctuations do not match international review fluctuations.
- Both domestic and international reviews hit rock bottom around April 2020.
These numbers reflect the differences between international reviews and domestic reviews. One possible interpretation of this is the consumer market. For domestic consumers, there is a wider range of possibilities: Harvard students, tourists, prospective students, and locals. On the other hand, international consumers mainly consist of tourists. This also may serve to explain the different oscillations in reviews. For example, domestic reviews dropped in May 2019 while international reviews continued to increase along peak tourism schedules. This potentially coincides with Harvard students leaving for summer break.
However, the peak that occurs in March 2019 is hard to explain. Since it does not align with peak tourist demand (summer), there are some possible, but unlikely reasons: Harvard students returning back from spring break, increased marketing from local businesses, or just pure coincidence.
Some data specific takeaways are:
- Domestic reviews hit their peak in March and August of 2019 at ~60 reviews.
- International reviews hit their peak in August of 2019 at ~25 reviews.
- In April 2020, domestic reviews steeply dropped from ~20 reviews to 0 in contrast to a drop from ~2 to 0 for international reviews.
- Following August 2019, both international and domestic reviews have been on the consistent decline, reaching 0 in April 2020.
- In July and Aug 2020, domestic reviews increased to 5-7 while international reviews remained constant.
These numbers reflect COVID policies in the US. From March 24 to April 7, 2020, Massachusetts shut down non-essential businesses, effectively rendering these restaurants incapable of receiving reviews. In June of 2020, Massachusetts began phase II of its reopening - restaurants were first allowed to offer outdoor dining, expanding to indoor table service later that month - which is why the number of reviews jumped up slightly. In contrast, international restrictions were still in place, keeping the international reviews down.
Without any timeline of unraveling of international restrictions and a dampening of domestic tourism as well, local businesses will have to depend more on other consumers: Harvard students and Cambridge residents. Shops that can’t cater to these markets may have to adapt or risk being outcompeted by growing chains.
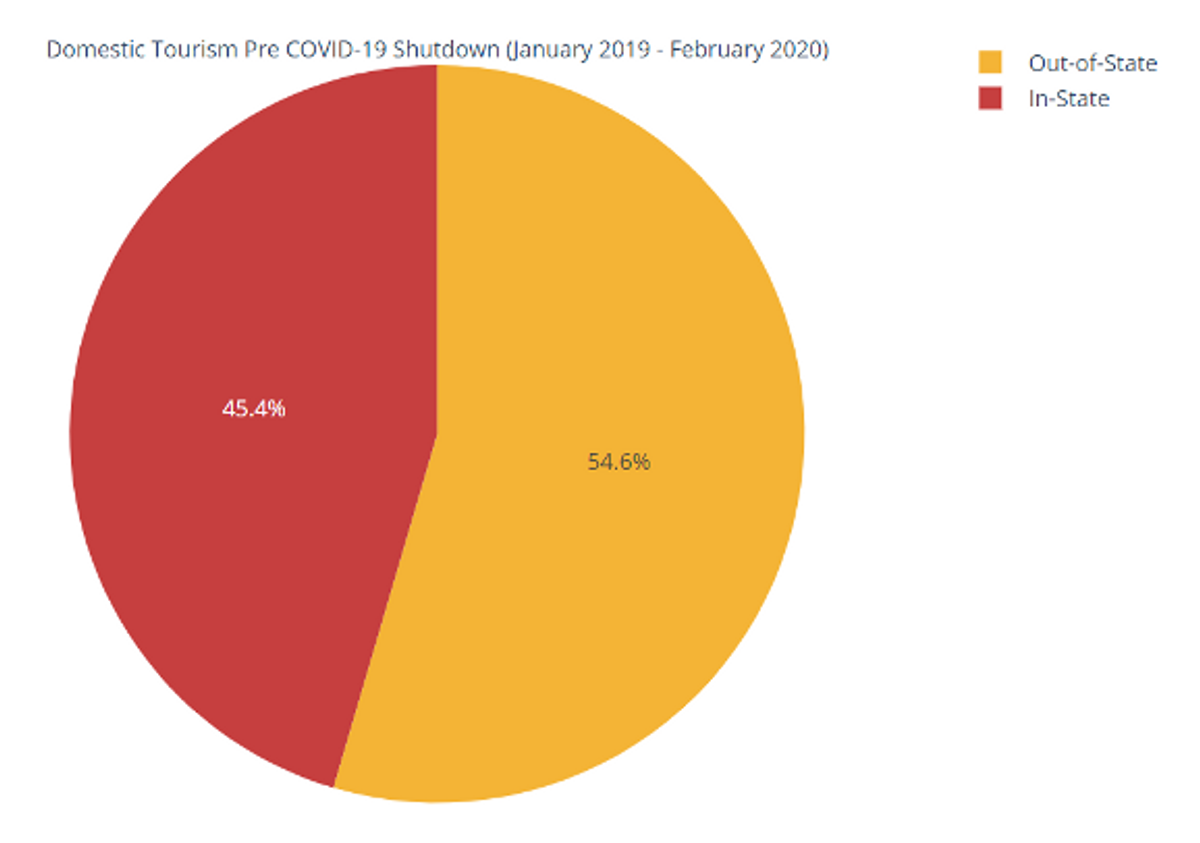
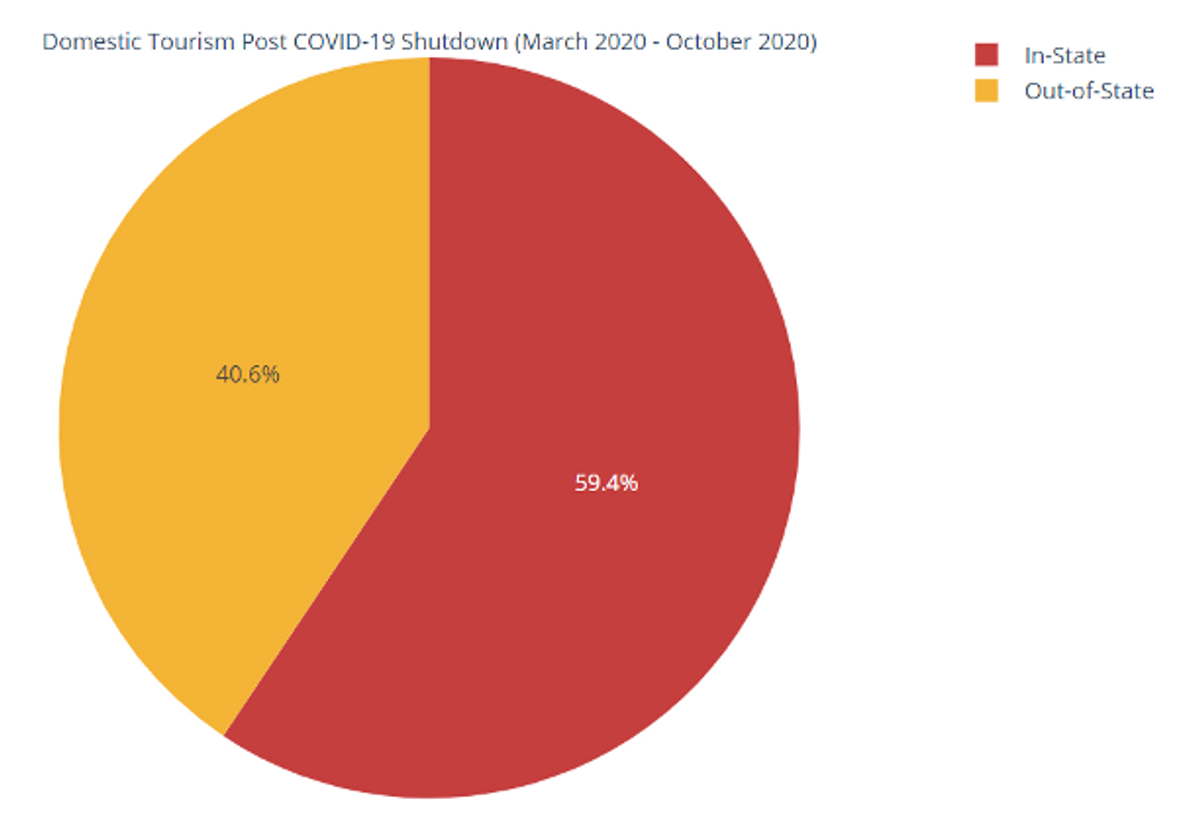
The 2 pie charts above reveal that COVID-19 has increased the proportion of in-state reviews.
- In-state reviews increased from 45.4 to 59.4% of domestic tourism reviews.
While current quarantine measures have limited or tried to de-incentivize travel, out-of-state reviews still occupy a sizable percentage (40.6%). We have some guesses as to why this is the case:
- Harvard students may consider themselves out-of-state.
- The majority of out-of-state travelers are from low-risk states as defined by the Massachusetts government (NY, VT, NH, CA), which means they are exempt from completing the Massachusetts Travel Form.
- As more time passes, people are desensitized to the impacts of COVID-19.
How have your favorite Harvard Square restaurants fared?
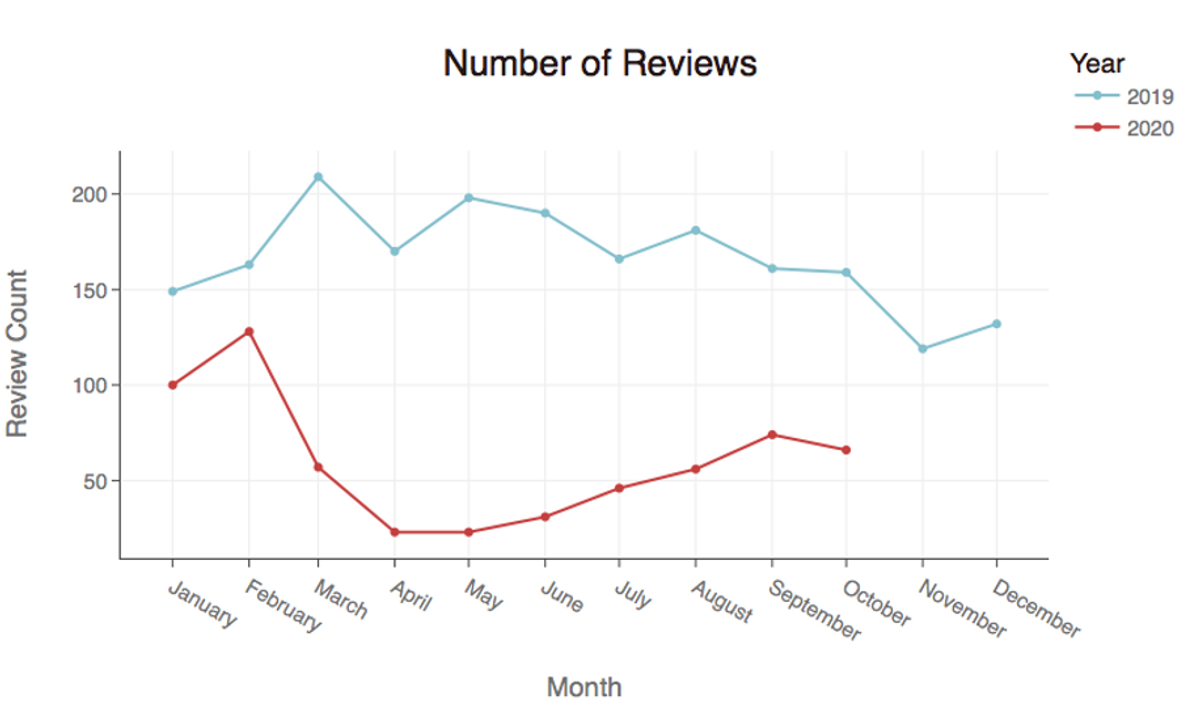
We also looked towards Yelp review counts for effects of COVID-19 closings on Harvard Square restaurants. Most notably:
- Harvard Square restaurants as a whole saw the greatest drop in the number of reviews received on Yelp in May, when there was a 175 difference in review count between May 2020 and May 2019.
- Prior to the growing prevalence of COVID-19 policy in the U.S., restaurants saw much lower differences between review counts of 2019 and those of 2020. January review counts differed by 49 reviews, while February counts differed by only 35.
- Differences in review counts from 2019 and 2020 jumped from a 35 review count difference in February to a 152 review count difference in March, when the nation began implementing COVID-19 policies. This is the greatest change in difference between months we observed.
- The lowest difference post-COVID was in September. However, October has seen that number rising again, as cases in the area have risen, a factor that has a discouraging effect on eating at restaurants.
Pricey vs Cheap: Is there a difference?
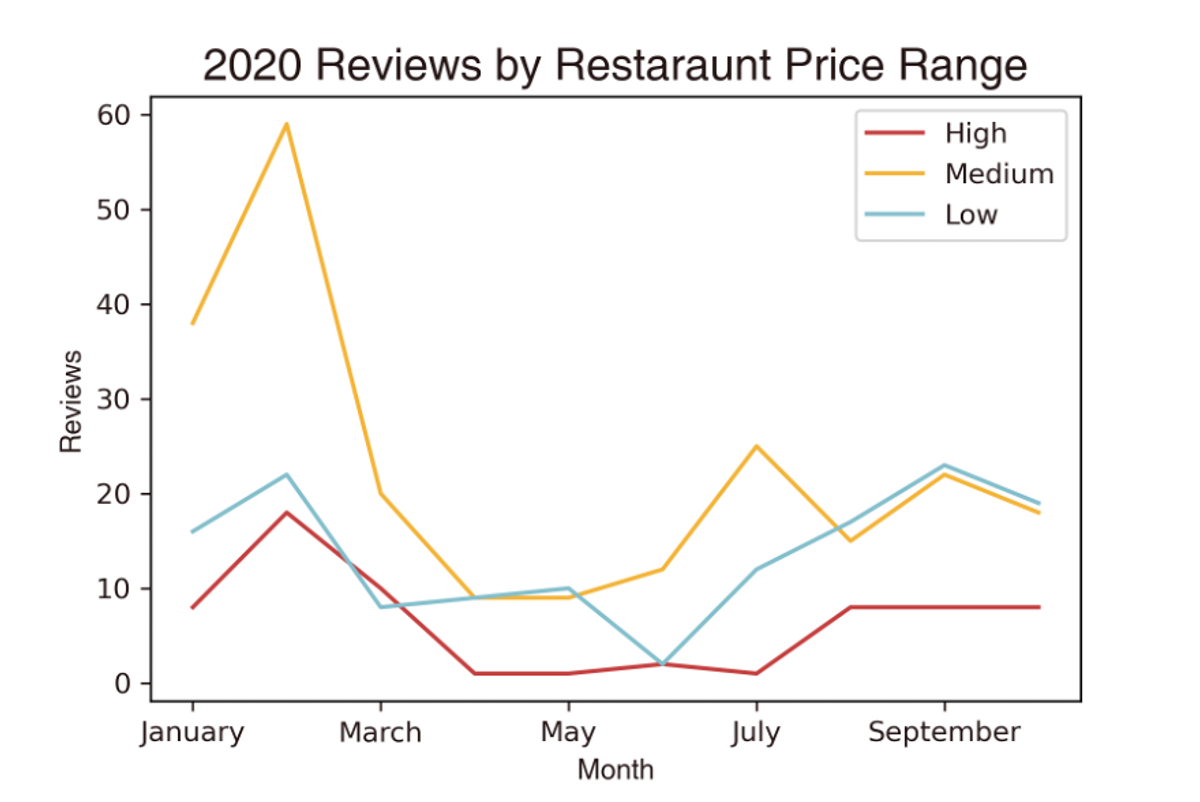
In the graph above, we look at changes in the monthly total number of reviews of Harvard Square restaurants as sorted by price range. Clearly, COVID-19 negatively affected restaurants, regardless of what price range they were in. However, there are some differences in recovery.
- Medium Restaurants ($$ on Yelp) have the least proportional recovery of reviews. With a peak of 60 in February and around 20 in September, medium restaurants recovered 1/3rd of their reviews.
- High Price Restaurants ($$$ on Yelp) had moderate recovery. With a peak of ~20 in February and ~10 in September, they recovered 1/2th of their reviews.
- Low Price Restaurants ($ on Yelp) had full recovery. With a peak of ~25 in February and 20+ in September and August, they have completely bounced back.
We speculate that low price restaurants had the highest recovery rates due to an easier transition to delivery or on-site pickup. Lower cost restaurants stereotypically have fast-food or grab-and-go services. In contrast, high cost restaurants, especially those that provide a fine dining experience, may not have the infrastructure for delivery. Consumers pay higher fees not just for the quality of food, but also the restaurant experience.
Take-out, Delivery, and Dine-in: What’s popular?
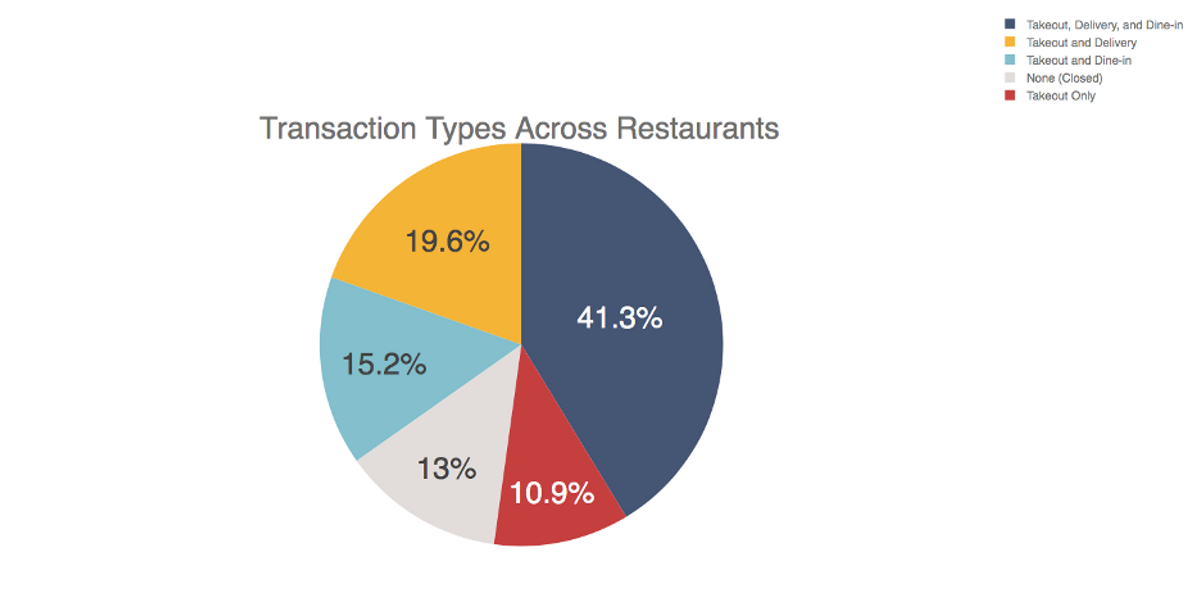
The pie chart above categorizes Harvard Square restaurants based on the transaction types they offer, as most recently updated on Yelp at the time of data collection, post-COVID-reopening. Following COVID-19 safety guidelines upon reopening, restaurants have adapted their operations, offering combinations of three forms of transaction: takeout, delivery, and dine-in.
Here are some of the key takeaways:
- In order from most popular to least, restaurants have reopened to offer takeout, delivery, and dine-in.
- While all restaurants that reopened offer a takeout option, we found no Harvard Square restaurant that was delivery-only or dine-in only.
- Most restaurants chose to offer all three options: 41.3% of the restaurants offer customers a choice between dining in, getting takeout, and having food delivered.
Unanswered Questions
In order to get an overview of the extent of the effect of COVID-19 on Harvard Square restaurants, we looked at various facets of the dining experience, from both the supplier and consumer side, and our results are consistent with the implementations and changes of COVID-19 guidelines as the nation has adapted its policies and actions with the progression of the pandemic. However, it is also important that we consider how the populations of users of the sites we scraped our data from may affect these results. Who is excluded from the data set when we are only using data from Yelp and TripAdvisor, for example, or are there confounding variables associated with factors that make a person more likely to use a certain platform?
Consequently, future analyses could explore how rating count may vary with transaction type or price, or the distribution of consumers among various nations and states specifically. Is there any correlation between characteristics of the restaurant and the transaction types it offers? These could include the dining experience, type of food served, or typical consumers (college students, tourists, etc.).
Conclusion
Overall, our research analyzes how Harvard Square restaurants’ responded to and were impacted by COVID-19. Our main insights reflect a growing domestic consumer base compared to the international consumer base post-COVID-19, along with a majority of restaurants transitioning to takeout. This data could offer valuable insight for local restaurants adapting to crises, while offering data to the broader public about the activity of local restaurants, perhaps catalyzing support for these businesses.
You can check out the data used for this analysis here.