
Do Police Protests Work?
A data-driven analysis of police violence and activism
Another unarmed Black man has been killed by the police. His name was George Floyd. The video of a police officer’s brazen cruelty and his utter disregard for the words “I can’t breathe” was shocking, but not new. In March, Breonna Taylor was shot by police in the middle of the night after they broke into her apartment. In February, Ahmaud Arbery was chased and gunned down by two white men. Unfortunately, such tragedies are common: Black people have been killed and abused in this country for centuries.
Buildings in Minneapolis, Minnesota, where Floyd was killed, have burned to the ground. Curfews have been declared across the United States, and massive police responses have been mobilized. The protests across the country were some of the largest in nearly half a century, but demonstrations against police brutality are nothing new.
The #BlackLivesMatter movement was officially launched in 2013 by Black organizers Alicia Garza, Patrisse Cullors, and Opal Tometi when neighborhood watch coordinator George Zimmerman was acquitted of all charges in the killing Trayvon Martin, a Black teen from Florida. BLM also led protests across the country in 2014, after police officers killed Michael Brown and Eric Garner, and has since become a national movement, spurring widespread protests against police brutality and racial inequality in criminal justice over the past seven years.
We at the Harvard College Open Data Project were interested in studying the effects of these protests.
HODP conducts an empirical analysis to answer that question here.
The Data
We relied on existing datasets to measure both the number of killings by police and the number of protests. The protest data comes from a dataset used in a paper by Williamson, Trump, and Einstein that examines which factors contributed to the occurrence of BLM protests in 2014 and 2015. The data includes protests sourced from news articles written at the time, totaling 780 BLM protests during the two-year period.
Data on killings by police comes from the Mapping Police Violence project, which includes data from 2013 to 2019. The data is sourced from media reports of police violence, and includes demographic information on the victim, the location of the killing, and whether the victim was armed.
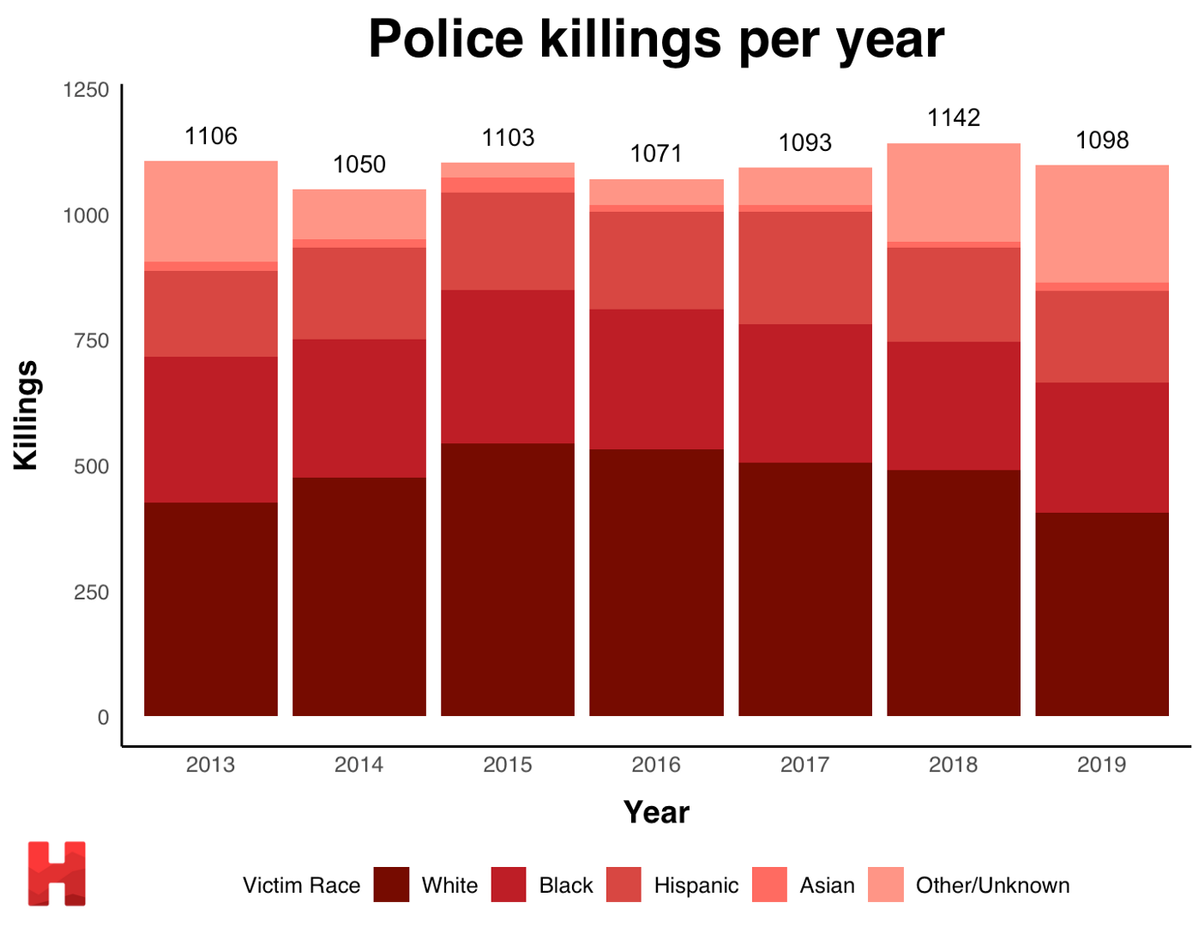
Some preliminary analysis of the data gives us a picture of police violence trends over time.
We can also get a sense of the number of killings where the victim is reported to be unarmed.
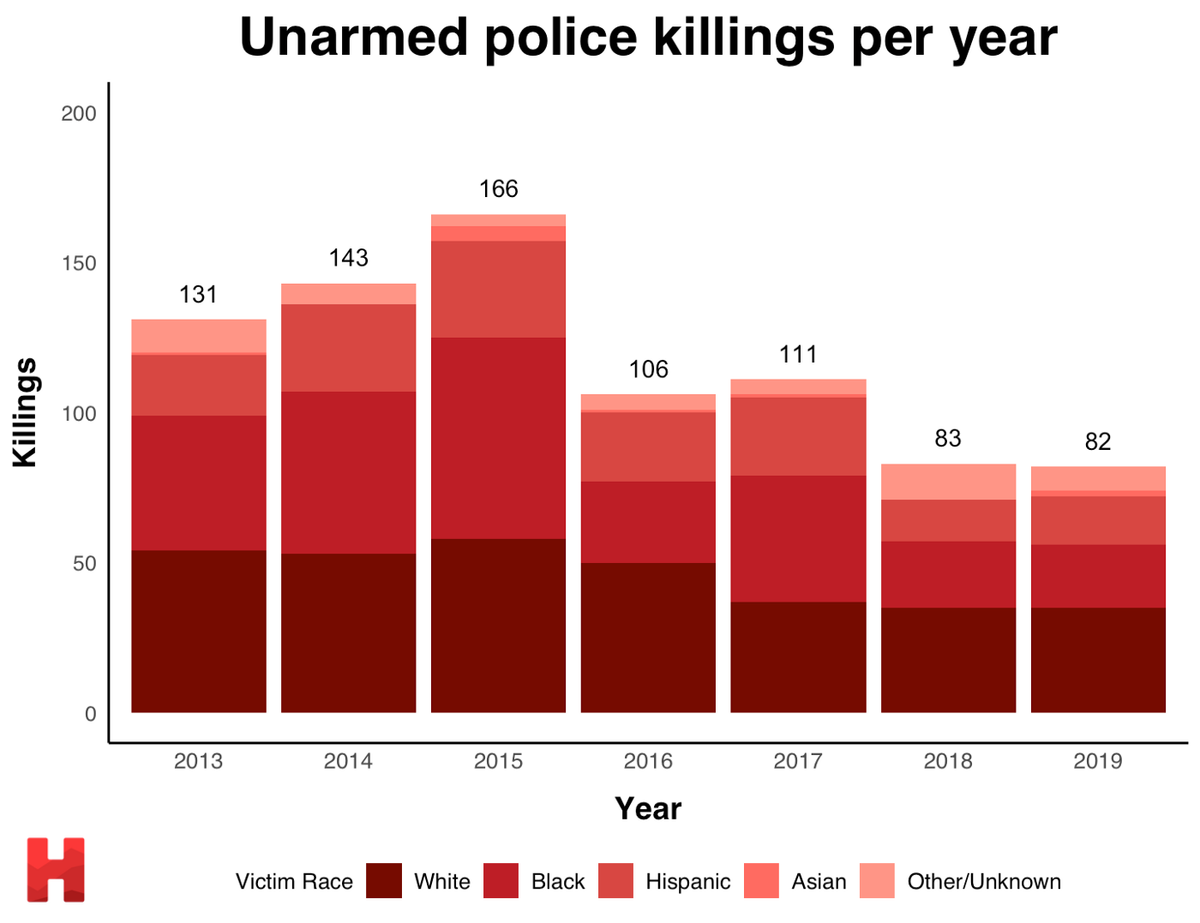
While it seems like the number of reported unarmed killings per year has declined since 2015, the overall number of killings has remained largely the same. However, these statistics are all on a national scale. In order to really understand the effect of protests, we need to perform a deeper analysis to see how protests affect local police killings.
Analysis
To gauge the local effect of protests on police killings, we decided to examine them at the city level. Both the protest dataset and the killings dataset labeled the cities in which they occurred. To make sure our analysis was not overly affected by outlier cases (e.g., where a city normally has no killings, but then has two killings in one year), we decided to limit our analysis only to cities that had at least 10 police killings between 2013 and 2019, which left us with 96 cities. We then regressed the change in the number of killings from 2013–15 to 2016–18, both three-year periods, against the number of BLM protests that happened in that city in 2014–15.
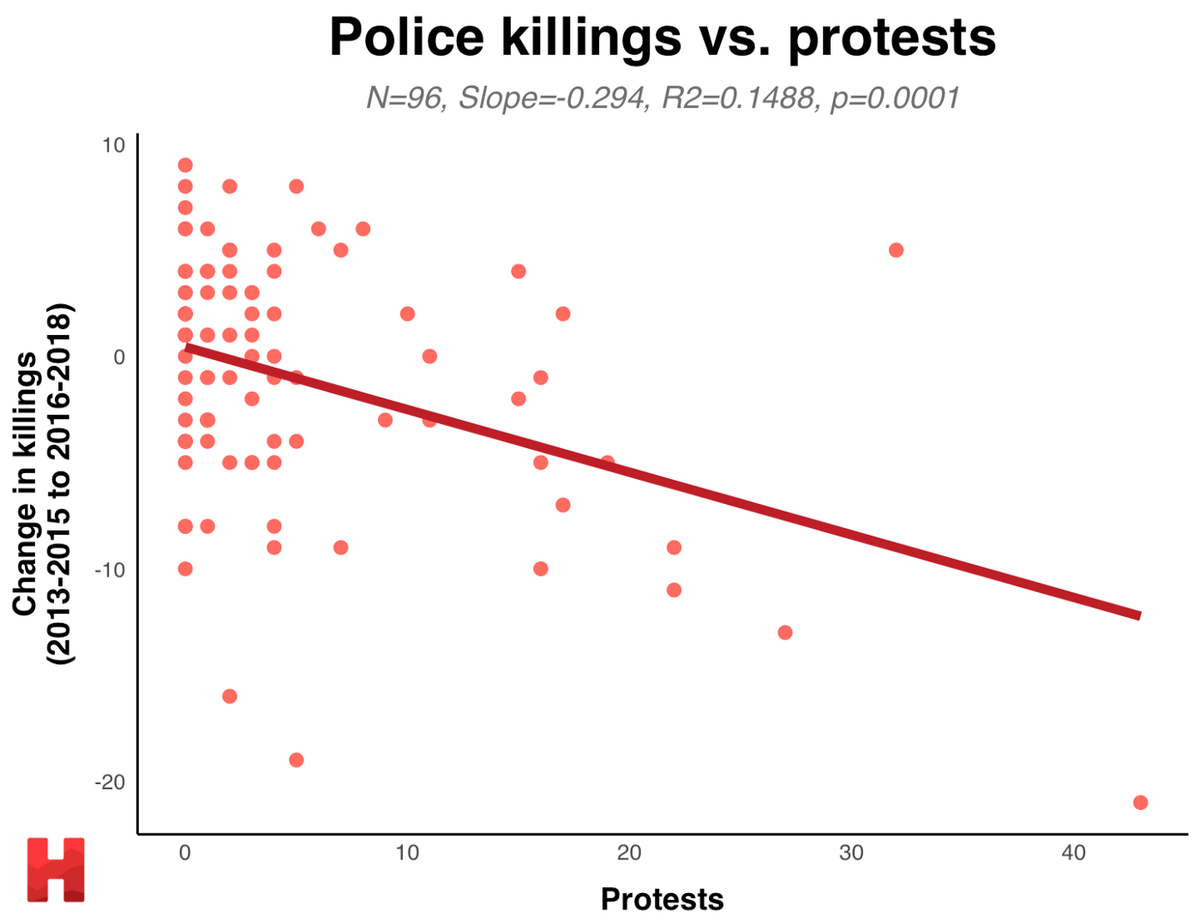
However, the above analysis is a bit problematic because we do not account for how many police killings were in a city in the first place. This leads to cities that already had a lot of police killings exerting far more influence on the final result than might be desired.
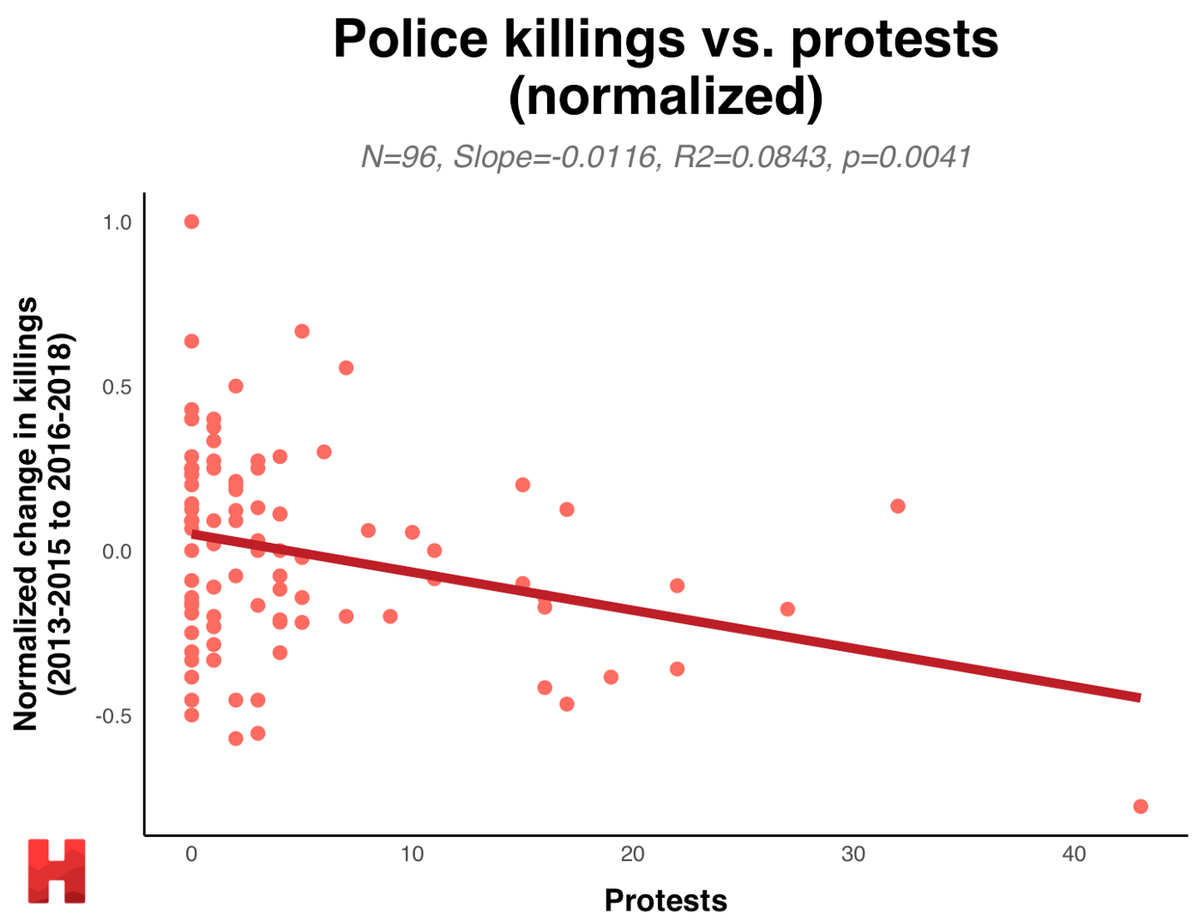
To account for this issue, we normalized the change in the number of killings by dividing by the total number of police killings in the city between 2013–18. Once again, we find a statistically significant negative relationship. The y-axis can roughly be interpreted as the percentage change in the number of killings between the two three-year time periods. So, we find that on average, each additional protest in a city between 2014–15 reduced the number of police killings in the following three years by about 1%.
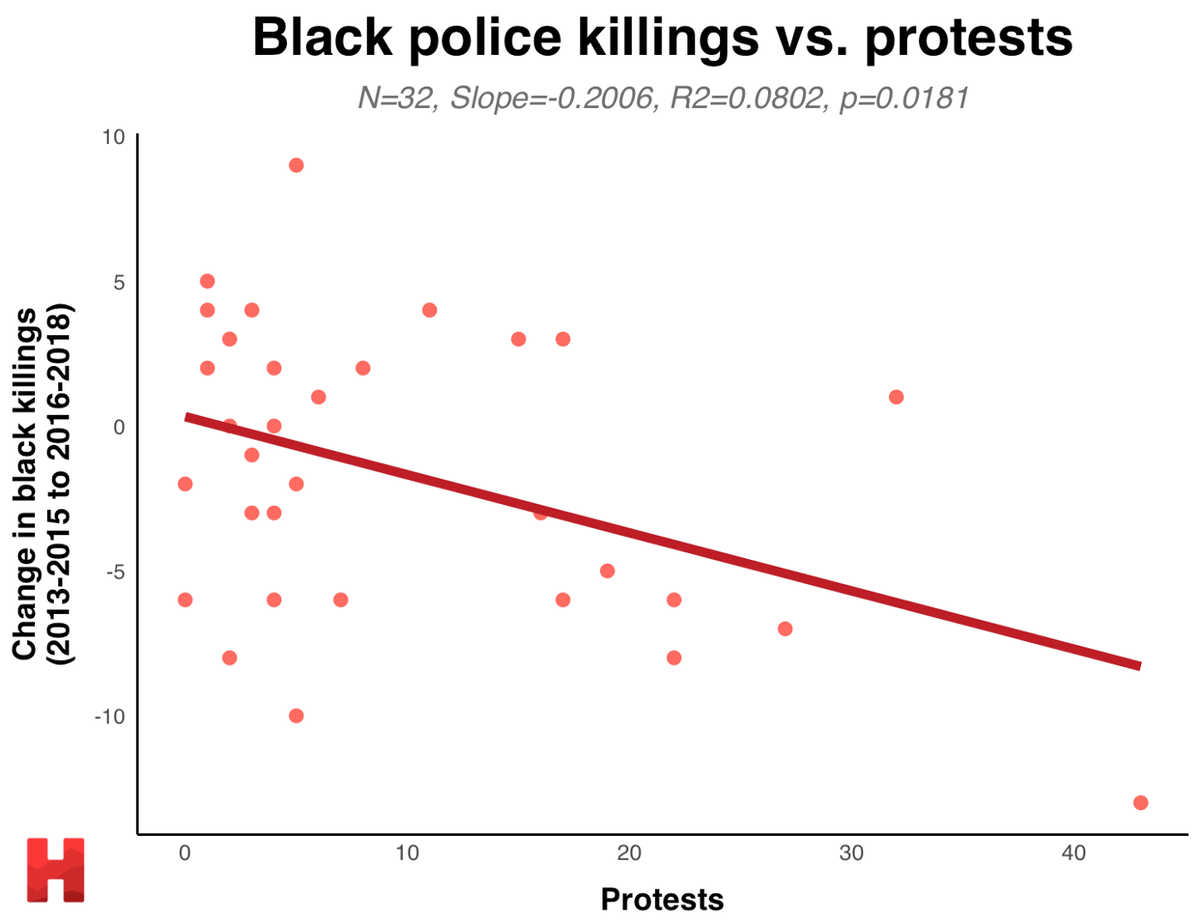
Of course, the BLM protests are not just about police violence in general, but about the targeting of Black Americans by the police. We performed a similar analysis on the number of Black individuals killed by police. In this case however, the number of cities analyzed was smaller because we restricted once again to the cities where at least 10 Black individuals were killed by police between 2013 and 2019, and there were only 32 cities where this was the case.
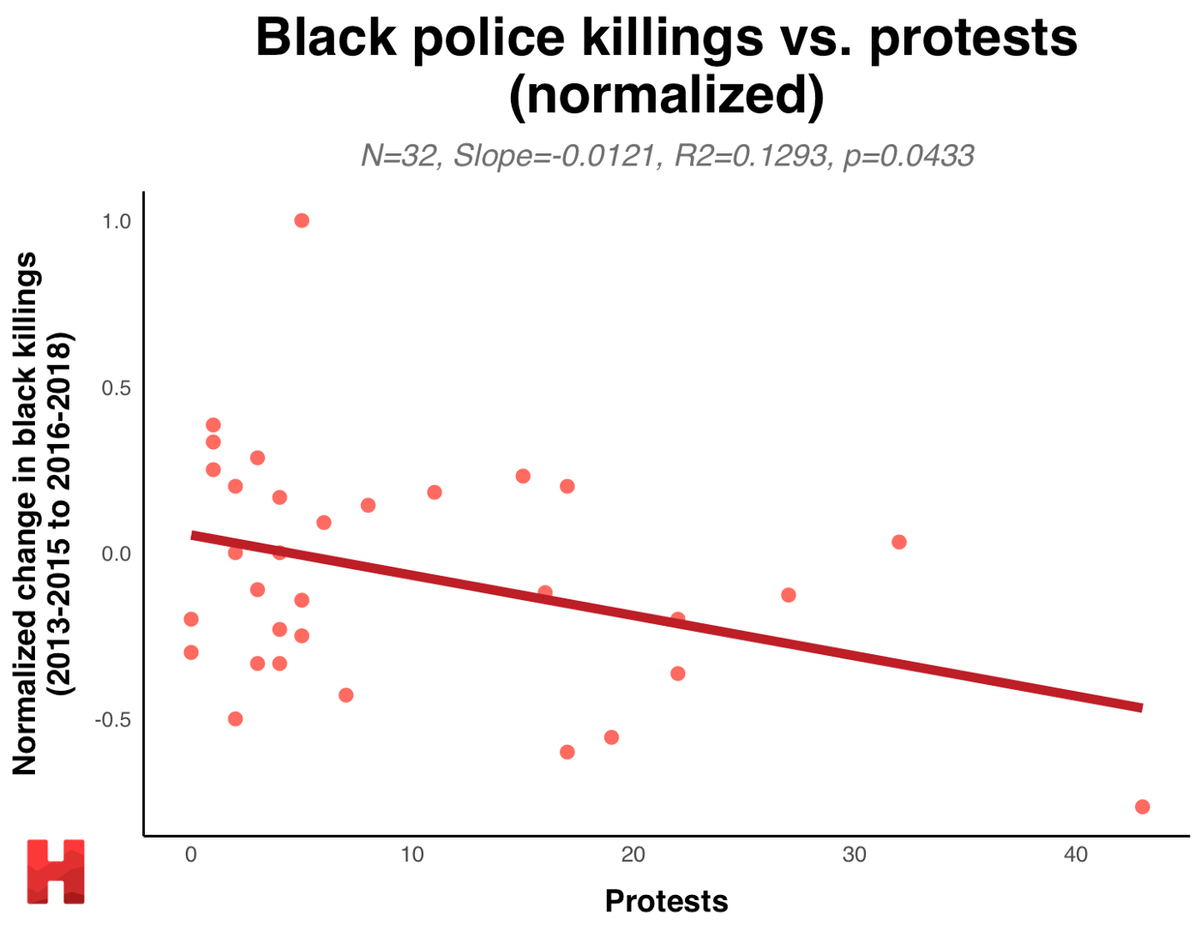
And we find the same negative relationship after normalizing for the total number of Black people killed by police during the time period.
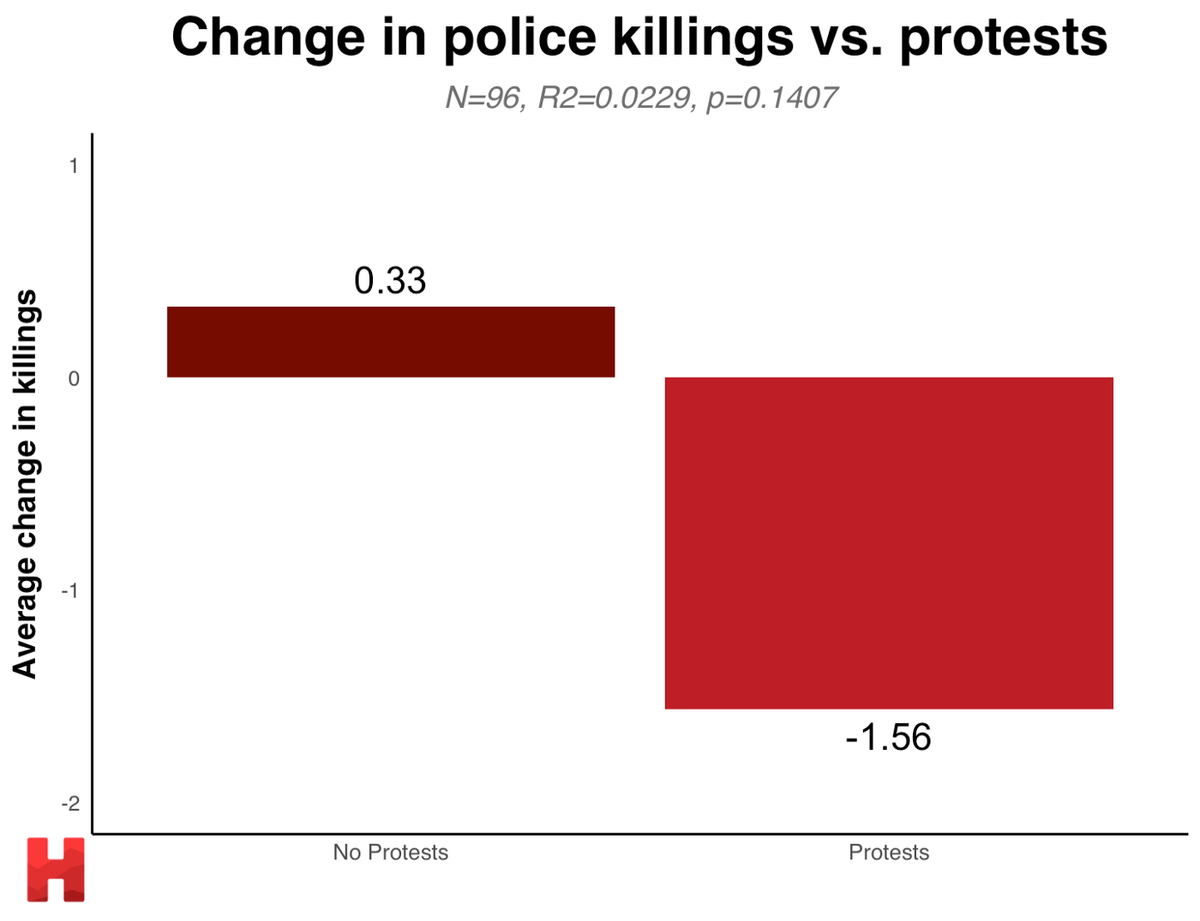
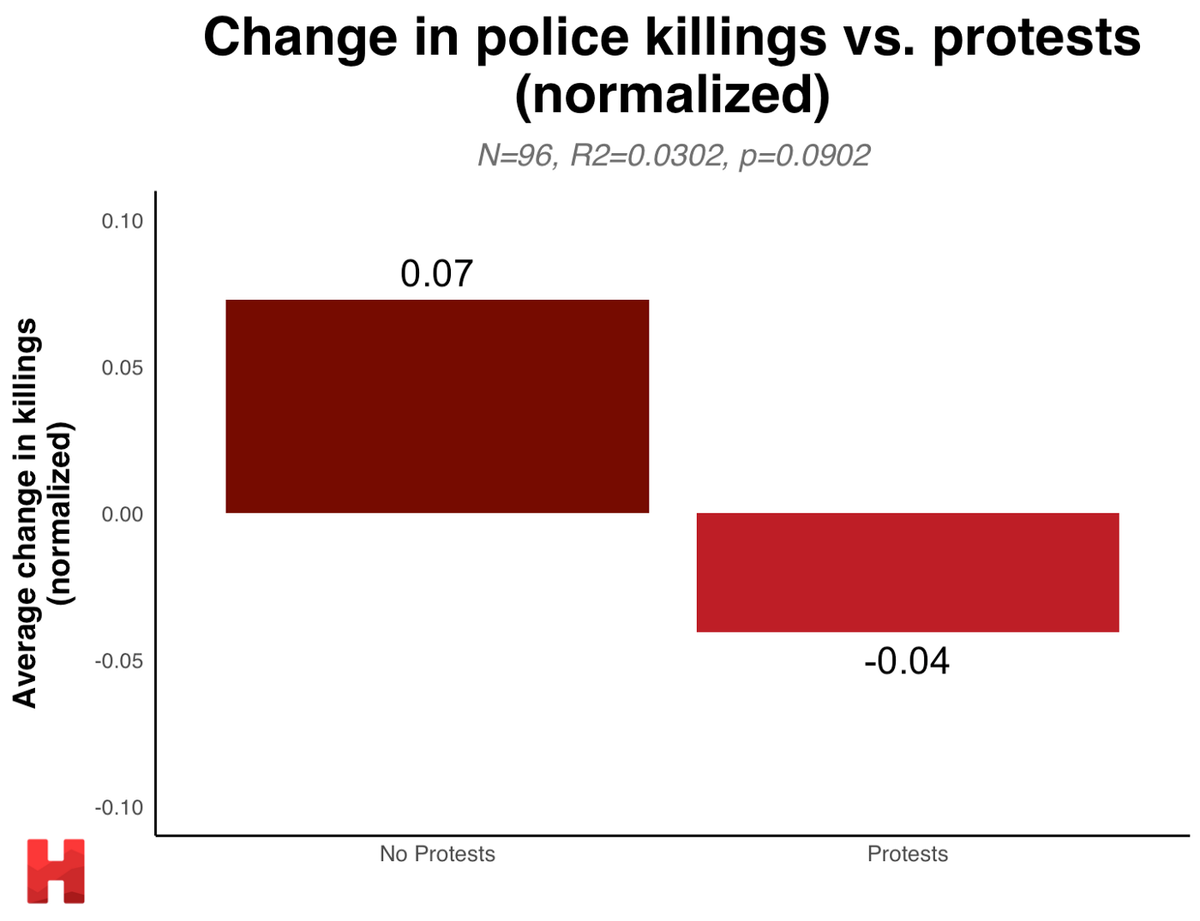
We also considered that maybe what matters is not how many protests there are, but whether there were any protests in a city. That is, it may be that each additional protest does little, but just having any protests at all is what matters. We compared the average change in the number of total killings in cities that had at least one protest against cities that had no protests. While there was a large difference in average change, the difference was not statistically significant at the 5% level.
An analysis with the normalized changes in each city shows similar but slightly more statistically significant results. This finding seems to suggest that it is not only the existence of at least one protest that matters, but that each additional protest continues to make a difference in the number of people killed by police for a given city.
It is important to note, however, that our analysis does not tell us the mechanism leading to this reduction in violence. It could be due to institutional police reforms in response to the protests, or it could be that police are simply less willing to use lethal force for fear of prompting more protests. In either case, though, this result is a promising sign that today’s protests can make a difference.
A Few Words of Caution
While we believe our analysis offers some fairly solid evidence for the effectiveness of protests, there are a few reasons for caution.
Mean Reversion
One issue that we were concerned about in this analysis was whether the decrease detected from 2016–18 was due to an unusually high number of killings by police in 2013–2015, which would have prompted protests, and that the subsequent reduction in police killings was simply a reversion to the mean. We attempted to correct for this by examining a three-year window rather than a single year, but it would have been preferable to compare to a longer-term trend prior to 2013. Unfortunately, we were unable to obtain such data.
Outliers
New York City had 43 BLM protests in 2014–15 and also had a sharp decrease in the number of police killings. While we do believe that the New York data point contributes nontrivially to the strength of our results, we found that the same negative correlation held after omitting the New York data point, albeit with less statistical significance.
Unreliability of Data
Unfortunately, data on both protests and police killings can be highly flawed. Both of our data sources compiled the killings and protests based on news articles. In particular, this is because previous self-reports of killings by police departments have proven unreliable. However, we do not believe that there is any systematic bias in the data that would weaken our results.
Correlation vs. Causation
This analysis is correlational, which of course does not necessarily imply causality. While reverse causality seems unlikely in this case (future decreases in police killings would not increase the number of protests), there is possibly some omitted, confounding variable. For example, it could be that communities that protest more are more civically engaged, and therefore also more capable of pushing for reductions in police violence.
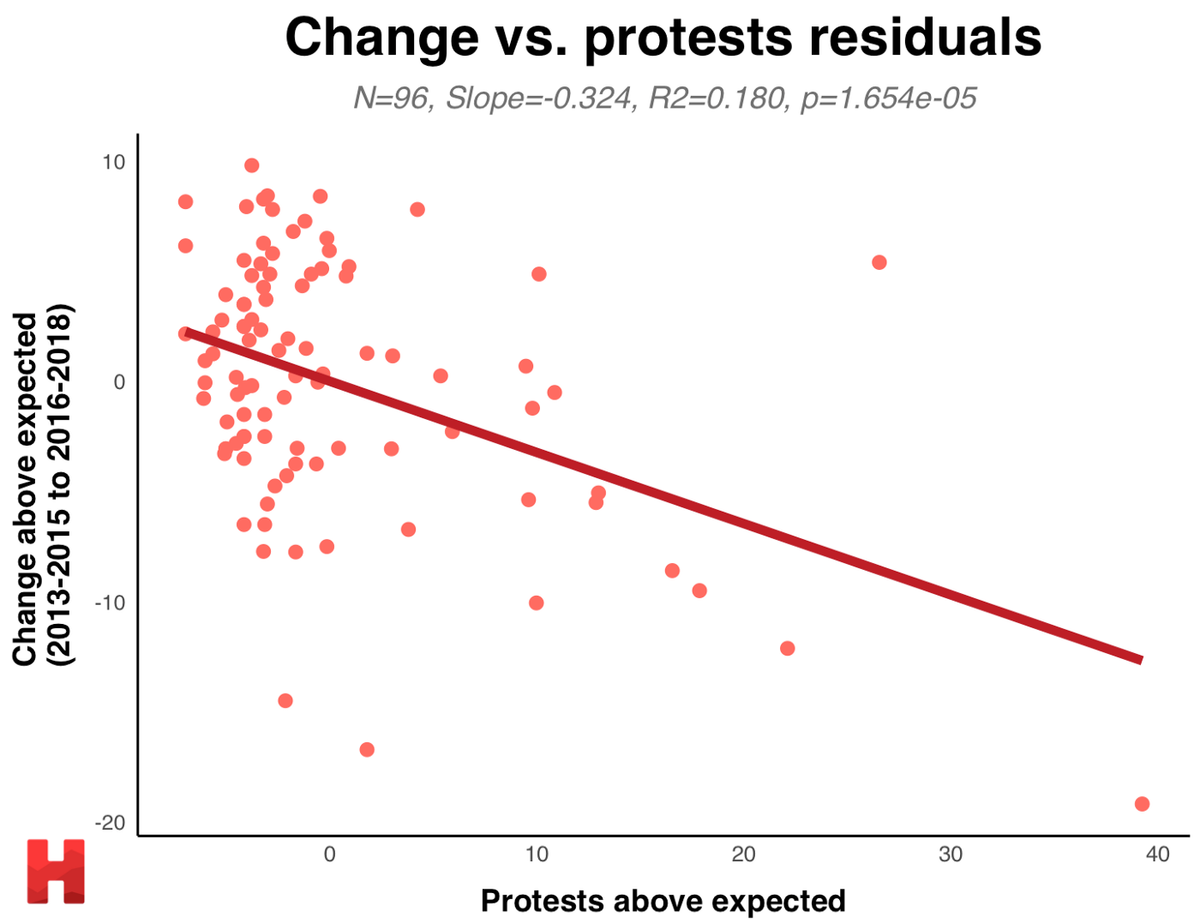
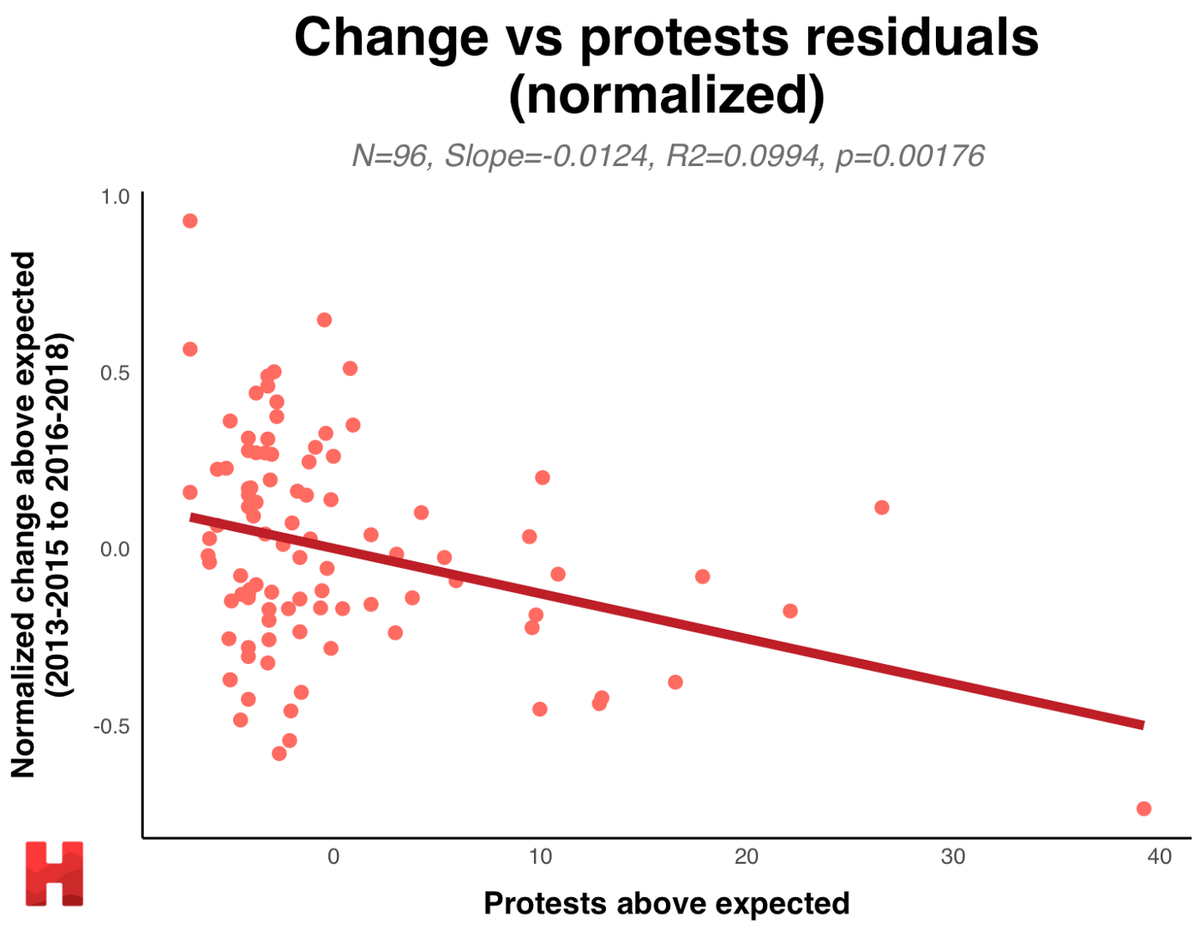
To control for the possible confounder of civic engagement, we ran an additional regression controlling for the 2012 presidential turnout of the state (turnout data was unavailable at the city level) using data from the United States Election Project. We used 2012 because it predates the BLM protests, enabling us to capture the preexisting civic engagement. Not only did we obtain largely the same results for both normalized and unnormalized regressions, but they became even more statistically significant.
Below, we have plotted the voter turnout residual regression of killings on protests. The x-axis is the difference between the actual number of protests and the expected number of protests based on voter turnout, and the y-axis shows the difference between the actual change in killings for a city and the expected change given voter turnout.
It is important to note, however, that this finding does not rule out all other possible confounding variables, and so some caution should be exercised in causal claims of protests decreasing police violence.
Related Work
While we are unaware of any previous work that has examined the effectiveness of the BLM protests in reducing police violence, there has been notable work on BLM and protests generally. Williamson, Trump, and Einstein, from which we obtained our protest data, finds that BLM protests are more likely to occur in areas with a history of police violence against the Black community.
On the issue of the effectiveness of protests, Madestam et al. find that protests by the Tea Party strengthened Tea Party support among the general public, increased the number of votes received by Tea Party candidates, and led to incumbent legislators voting more conservatively. In other words, protests can and do affect legislation.
Finally, one potential area of concern comes from Ba and Rivera, which finds that police may also become less active in response to civilian complaints leading to a rise in crime rates. This result may indicate that the reduction in killings by police following protests is not a result of reform but rather of police no longer responding to crime reports as vigorously. We were unable to quantify police reforms in order to correlate with protests, but that may be a viable area of research if the data is made available.
Why it Matters for Harvard
Most HODP analyses include a Harvard-specific dataset, but unfortunately, we were unable to develop one for this article. We reached out to the Harvard University Police Department for data on the number of complaints against officers, but we were denied access. We will continue trying to obtain data from the administration and searching for ways to analyze police, racism, and protests at Harvard through publicly available data.
While there is no Harvard-specific application for this analysis, we believe that this article is important for everyone, including the Harvard community. Numerous Harvard organizations, including HODP, have taken action to support and raise money for the nationwide movement against racial inequality, racism, and police violence. Many students are protesting, raising awareness, and donating to the cause. We hope that this analysis serves as a reminder that actions can and do create change in our communities.