
Crime and Risk: Using Open Data to Make a Safer Community
Ideas for how data-driven tools can be used to protect our community.
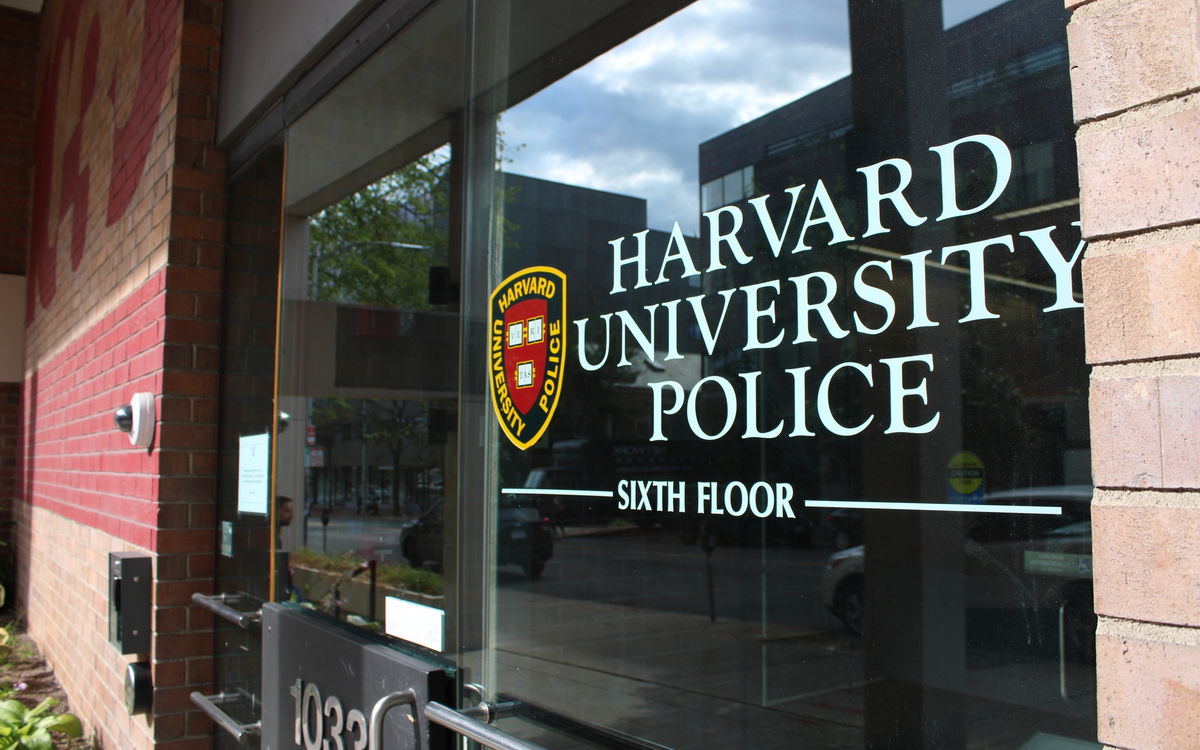
Fortunately for us, we Harvard students have the service of the Cambridge Police Department and also Harvard’s own police department, HUPD (Harvard University Police Department). HUPD is a phenomenal unit of dedicated and friendly officers who work hard to keep us safe — but despite all the diligence in the world, students unfortunately occasionally fall victim to crime.
So what could have gone wrong? How can students be at risk of crime even with the protection of two police units? To answer this question, I’ll provide an anecdote provided to me from Erie Meyer, one of my mentors, from when she started her career in Washington D.C.
The answer is simple: a lack of open data and the tools to analyze it.
Every police department is legally required to produce logs detailing any reported incidents and crimes. However these logs are often very inconvenient to browse through and analyze, which makes studying crime and developing programs for prevention hard. Thus even with publicly available data, we run into obstacles, primarily in that the current format (or lack thereof) makes it difficult to work with this data, which effectively creates a vacuum in the space of police data tool.
That’s where we come in.
We’re the Harvard Open Data Project’s HUPD Crime Watch team. The goal of the project initially was to plot geographic distributions of reported crimes off HUPD logs. Due to the format of how logs were presented on their website (as separate downloadable PDF), the initial implementation involved batch downloading them, converting them to .txt files and using a parser built in C to collect each entry into a MySQL database. From there, PHP, HTML, CSS, and JavaScript along with Google Map’s API were used in developing a rudimentary display of the data. It used Google Maps’s native red pin to plot each distinct location of crimes. Upon click each pin, you’d get a list of crimes reported with that address/location and, upon clicking each crime, you could see more details. Although simple in concept, it’s the beginning of what will be more complex police data-based/data-driven tools.
In addition to this, our goals for the project now include creating a form to collect police incidents, a better map interface, and a navigation feature.
Collecting Police Data More Directly
The current method involves manually downloading the PDF logs and then parsing its .txt version. Although getting the logs can be automated, the issue of parsing remains a challenge due to unusual character syntax that can break the patterns.
Our proposed solution: to develop a form that would let HUPD enter in incidents and crimes directly into our database such that they get their PDF files to put on their website while we get their clean raw data for analysis. We hope to create this using Python, Django, and SQL.
A Better Data Interface
The current map is bare-bones, but we want to make it a more powerful visualization tool. For instance, we want people to be able to run interesting queries like organizing incidents by day, time, type, etc., while also being able to generate high-level insights from just seeing the map.
This will involve becoming more comfortable with the Google Maps API and perhaps using other libraries like d3.js, a popular data visualization JavaScript library.
Navigational Tool
We want to leverage our data to provide powerful recommendations to students: we want to replicate Google Maps’s directions feature by showing users not just the fastest route between two points but also the safest one, taking into account the crimes reported and their locations.
This is a big-picture goal that we’d like to see by the end of next year. We expect that it’ll take extensive experience with the Google Maps API and algorithmic design to implement.
Fired up
With this project, we hope to not only make the community safer but also usher in a new era of data-driven police tools and analytics.