
COVID-19 Closures in Cambridge
Did the lack of students in Cambridge contribute meaningfully to Cambridge business closures?
Introduction:
Cambridge, despite being an industry leading city, holds on to that quintessential college town atmosphere. Harvard Square is always filled with students rushing from their most recent coffee fix to Widener and back again. Restaurants that both current students and alumni can rave about continue to keep their doors open. But when COVID-19 kicked students off campus in March of 2020 and businesses closed their doors, Cambridge changed. Now, in the tail end of the pandemic with more students returning to town, we wanted to assess whether businesses in student-dense areas of Cambridge were disproportionately affected by the pandemic.
We used data from Cambridge Open Data, a program run by the City of Cambridge for the public good. We decided to use two datasets—one that gave information on lengths of vacancies in different commercial districts and one that had information on the “storefront status” – the extent to which businesses were open and operating – of Cambridge businesses. Both datasets are current only through December of 2020. To use this data to answer our questions, we adjusted both data sets to show distances from the centers of both MIT and Harvard (We used the John Harvard Statue and the Great Dome as the centers of Harvard and MIT campus respectively).
Where are recent business vacancies located?
The effects of COVID have been disastrous for many local businesses across the country, and despite governmental attempts to offer support through stimulus packages, many have been forced to close their doors permanently. Looking specifically at Cambridge, we wanted to explore where the majority of these business vacancies are located. Have restaurants nearer to Harvard and MIT been hit harder due to a lack of college students?
To answer these questions, we take a look at recent vacancies (vacancies that have lasted for less than two years) and see where they are located in relation to the two major campuses in the city. 1-2 year vacancies represent a sort of control group, accounting for vacancies that occurred prior to the pandemic (December 2018 - December 2019). The 6-10 month vacancies account for those vacancies following the breakout of the pandemic from March 2020 – June 2020.
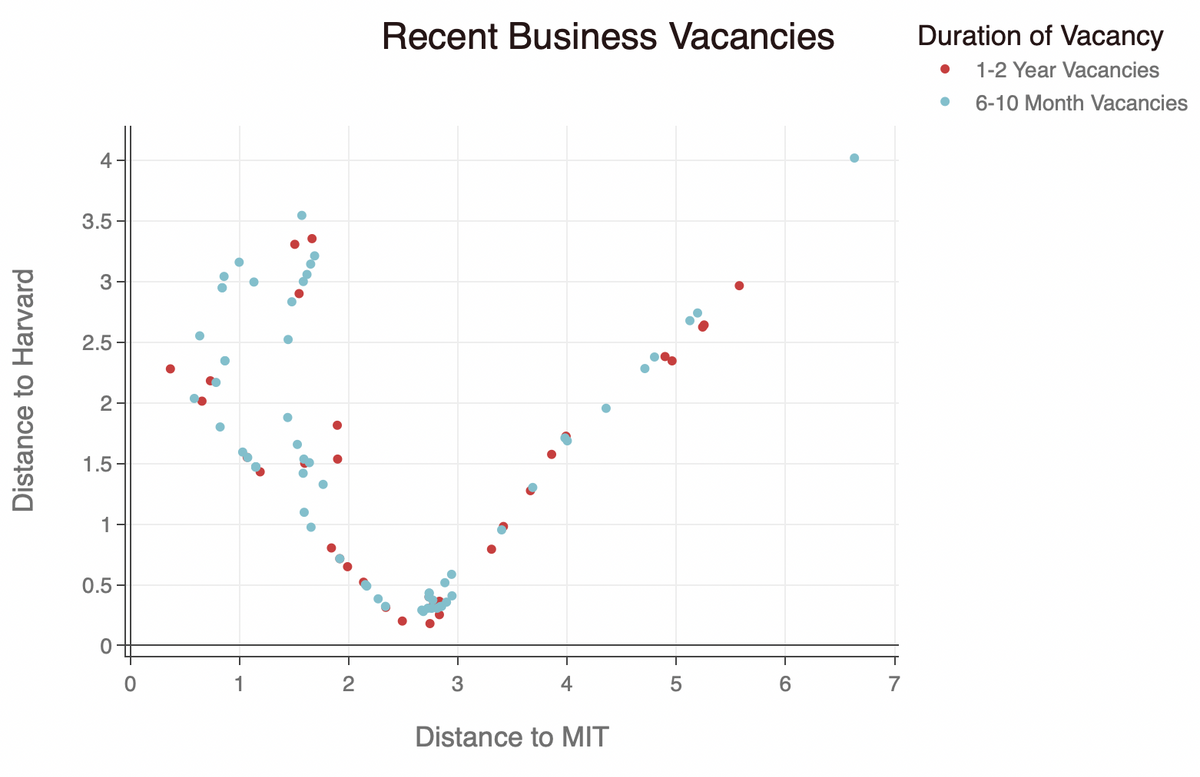 Figure 1: The above scatterplot shows the location of all recent vacancies (less than 2 years) with the distance from MIT and the distance from Harvard plotted on the x and y-axes respectively.
Looking at the above scatterplot, we can see that the vast majority of recent business vacancies, both pre-pandemic and post-pandemic, have occurred in close proximity to Harvard and MIT campuses. Note that businesses that are located far away from both Harvard and MIT would be plotted in the top right section of the plot.
This is what one might expect from a college town. The turnover rate for businesses near campus tends to be higher than for those businesses further from campus, and many factors may help to explain this trend. Higher rents near campus, increased volatility from a customer base composed mostly of students, and a higher overall number of businesses near campuses all contribute to an increase in the number of vacancies near a college campus.
While the overall trends are similar between the two periods, there are still some interesting differences and takeaways from the plot.
- The scatter plot presents a general V-shape as vacancies are located either in the vicinity of one of the two campuses or further away from both Harvard and MIT.
- There is an increased number of vacancies in very close proximity to Harvard and MIT.
The V-shaped pattern of the scatterplot is likely explained by Cambridge’s own borders and geography, with most businesses lying in one of the three regions described above. One potential explanation for this fact relates to the large number of businesses located on Mass. Ave. Starting from MIT and heading towards Harvard along Mass. Ave, one gets closer to Harvard before ultimately heading away from both campuses. The large proportion of businesses along Mass. Ave would naturally lead to more business vacancies along the street, thus explaining the V-shaped pattern visible in the plot.
The increased number of vacancies in close proximity to Harvard and MIT is a more interesting point, and it deserves to be examined in fuller detail in the next section.
Have business vacancies increased due to COVID?
The visualizations above certainly show that there has been an increase in the number of vacancies in the last 6-10 months and our control of vacancies in the past 1-2 years, but the scatter plots make that difficult to quantify. We looked at the number of vacancies in relation to their distance from Harvard and MIT separately, as seen below, but while they are good guiding visualizations, the ‘double-counting’ (due to the two distant campus centers) when comparing them can become confusing. As you can see, the spike from 2.5-3 in the MIT histogram is made up of the vacancies in Harvard Square (and vice versa).
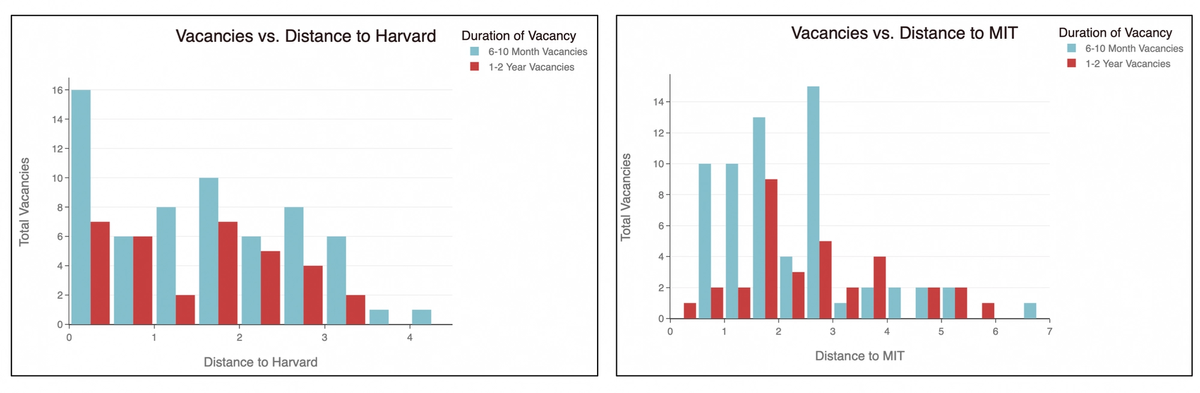 Figure 2: The histogram displays the total number of recent business vacancies (less than 2 years) in relation to the distance from Harvard (left) and MIT (right) campus. 6-10 month vacancies are in blue and 1-2 year vacancies are in red.
The data is more clearly shown when we look at business vacancies by their minimum distance to either Harvard or MIT; in this way, we are just looking at the distance from a ‘student hub’ or campus.
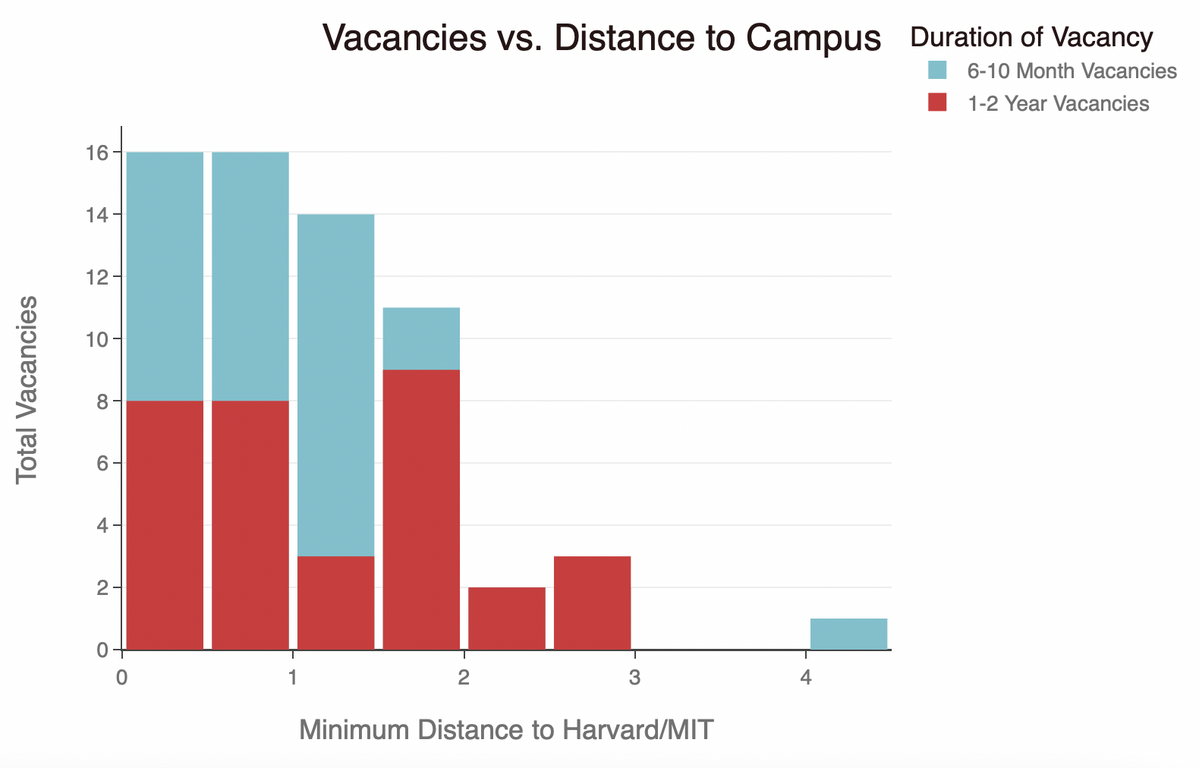 Figure 3: The histogram displays the total number of recent business vacancies (less than 2 years) in relation to the distance to the closest of Harvard/MIT, overlayed. 6-10 month vacancies are in blue and 1-2 year vacancies are in red.
Using this visualization, we can clearly see that there have been far more business vacancies than usual within 1.5 kilometers of Harvard or MIT. This seems to suggest that businesses near campuses have been hit harder by the pandemic than businesses further away. With Harvard and MIT allowing only a limited number of students to return to campus, the customer base of these businesses has been cut drastically, likely leading to a higher number of vacancies.
Looking further away from campus, there seem to be a similar number of business vacancies both before and after the pandemic. This weakens the explanation that the increased number of vacancies closer to campus is due solely to the time frame (shorter vacancies take time to be filled) and suggests that the effects of COVID have in fact been felt by businesses nearby campus.
How are restaurants serving their customers?
What about businesses that are still open? How has their proximity to school centers affected their opening status i.e. (Dine in restaurants, Takeout/Pickup, Delivery)? We used our data on open storefronts to categorize these open businesses in order to answer this question.
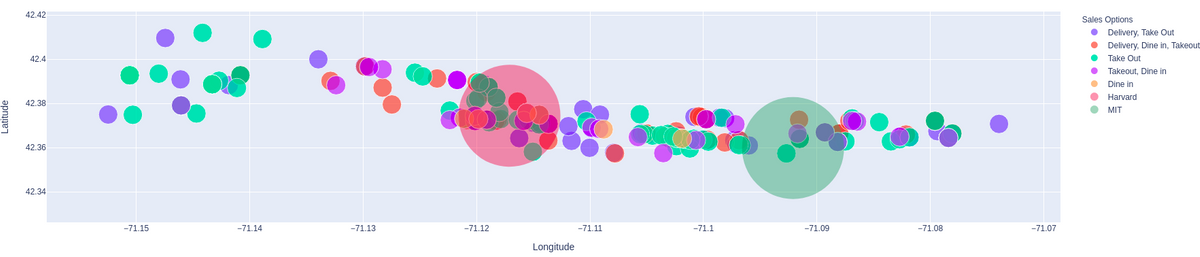 Figure 5: The above scatterplot shows the locations of all local businesses along Mass Ave. and their ‘Sales Option’ type, the data are mostly restaurants but other businesses available for pickup and shipping were labeled as takeout.
From the graph above we can see the way in which businesses along Mass. Ave are serving customers in relation to their location and distance from Harvard and MIT. We notice that distanced from the two school centers, businesses choose mainly to be open for either ‘delivery and take out’ or just ‘take out’. Conversely, around the school centers (especially in Harvard Square), there are more diverse options along with many businesses having ‘delivery, dine in, take out’. There are many possible reasons for this, including the larger amount of foot traffic in school centers that makes taking the necessary Covid precautions for dining in worth the expense for businesses near Harvard and MIT.
Unanswered Questions and Conclusion:
These data really only scratch the surface of the impact of COVID-19 on Cambridge businesses. While we tried to focus only on proximity to schools in the article, there are plenty of confounding factors that our data did not let us control for, such as, the biopharma hub near MIT that kept a steady flow of traffic in that area. Additionally, while preprocessing the data, we had to exclude some data to make clearer visualisations. We removed outlier stores that were too distant from Harvard/MIT campus as well as businesses which the MapQuest API could not find the coordinates of. Businesses which lacked information about their current sales options were similarly excluded from our analysis.
Future analyses could focus on the rate of closure throughout the pandemic, which was something that this article was unable to investigate due to the lack of relevant data. It would also be interesting to explore whether weather and season dictated how restaurants served their food or if it was more dependent on what ‘phase’ of COVID that the city of Cambridge was in.
Overall, the proximity to students has affected Cambridge businesses during COVID. We can see that the restaurants closer to college campuses are more likely to offer dine-in services. Conversely, we can also see that businesses close to MIT and Harvard were hit particularly hard during the pandemic. Our data could not determine whether this was solely due to the loss of revenue from students or just more general effects from COVID-19, however, it is undeniable that more vacancies were created in the last 6-10 months than in the past 1-2 years.