
Course Enrollment at Harvard On Campus vs Over Zoom
The COVID-19 pandemic moved classes and activities online. How did students adjust to this new college experience, as reflected by their course enrollment?
Introduction
In spring 2020, Harvard College students were sent home in response to the emerging COVID-19 pandemic. With students now located all over the world, learning moved from physical classrooms in Cambridge to online meetings over Zoom.
While prospects for students’ return to campus for the fall semester remained uncertain for much of the summer, it was established early on that, whether or not students would be on campus in the fall, learning would be taking place remotely. For many students, the prospect of remote learning could motivate a less stressful workload, inspire more focus on mental health and wellbeing, or indicate a more isolated learning experience. And so, just as professors made adjustments to their teaching techniques, assignments, and syllabi, students too were adjusting their plans and approaches for the new semester.
This article takes a closer look at the manifestation of one such adjustment in the form of changing trends in course enrollment data, seeking to answer the question of the impact of COVID-19 and the subsequent shift to remote learning on course enrollment at Harvard. We explore trends in the popularity of course subjects and course difficulty, and discuss possible influences COVID-19 may have had on these patterns. The insights from this article can help provide a look back on one way the pandemic affected our approach to education, and guide us when making decisions about remote course enrollment in the future and even as we move forward towards a return to in-person learning.
Data
The data used in this article was collected from the FAS Registrar’s Office.
We compiled course summary data for each semester from fall 2017 to the most recent semester of spring 2021. We categorized data based on when most decisions about course selection and enrollment are made. Thus, data from fall 2017 to spring 2020 is aggregated into “pre-COVID-19 data,” while data from fall 2020 to spring 2021 is considered “post-COVID-19 data.”
Broadly speaking, how much of an effect was there on enrollment by course subject?
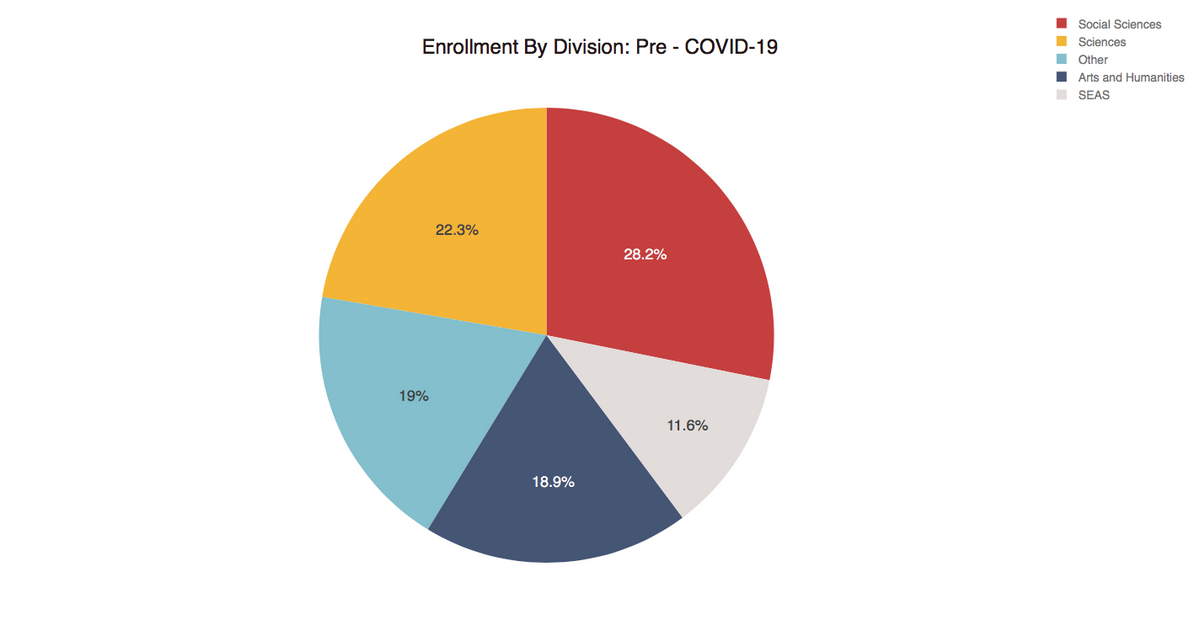
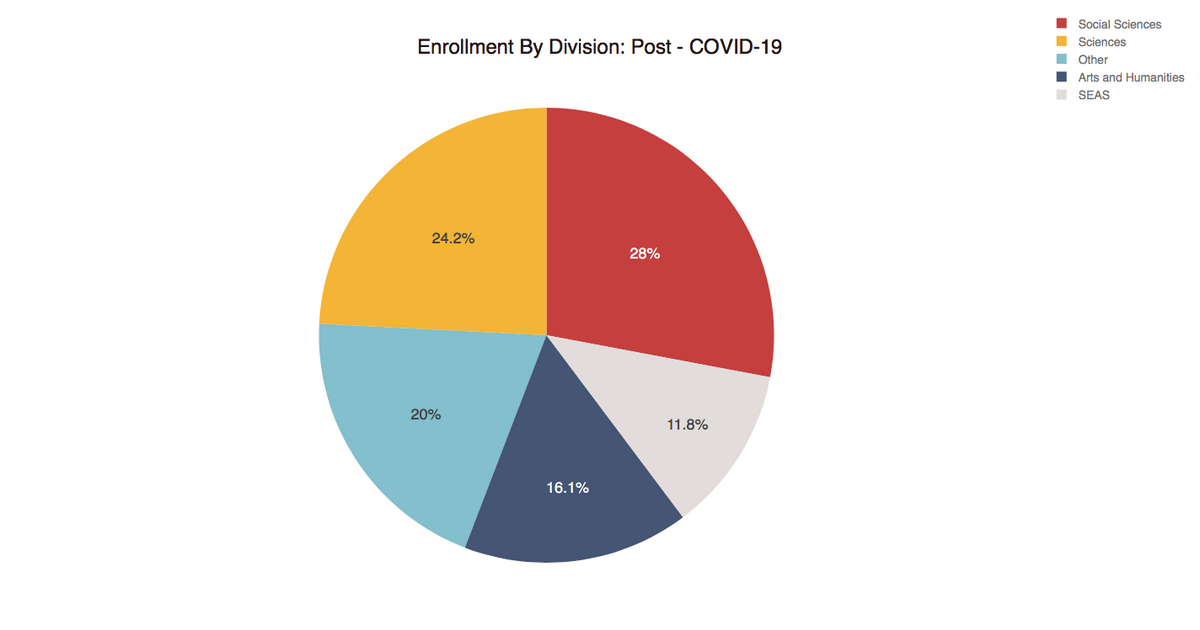
The two pie charts above depict the ways in which course enrollment is distributed across five main categories of courses, before and after COVID-19. Courses in the social sciences, sciences, arts and humanities, and from the Harvard John A. Paulson School of Engineering and Applied Sciences (SEAS) make up four of the five categories. Expository writing courses, freshman seminars, general education courses and not-yet-categorized courses are grouped into the fifth category labeled “other.”
Broadly speaking, there do not appear to be drastic differences in the distribution of course enrollments across these five categories before and after COVID-19, which we can more clearly see from the stacked bar chart below. Note the addition of the “adjusted” category, which accounts for classes not in any of the five other categories. These include, for example, classes that were offered one year but not in others.

Moreover, since we only have two semesters of post-COVID-19 data and many shifting variables, it is difficult to accurately attribute any changes to the emergence of the pandemic or the shift to remote learning.
Nonetheless, from the two charts we see that:
- Course enrollments changed by the largest percentage in courses in the arts and humanities, decreasing by 14.8%.
- The largest positive change was for science courses, which saw an 8.52% growth in enrollment.
- Course enrollments in science courses, “other” courses, and SEAS courses increased while those in courses in arts and humanities and social sciences decreased.
Perhaps the spread of COVID-19 piqued interest in courses in science and engineering. From research on the virus itself to the innovation of new technologies and platforms as we have adjusted to a new normal, it could be possible that COVID-19 and the ways it has impacted our everyday lives have also influenced the courses we have chosen to take.
What if we take a closer look at course department?
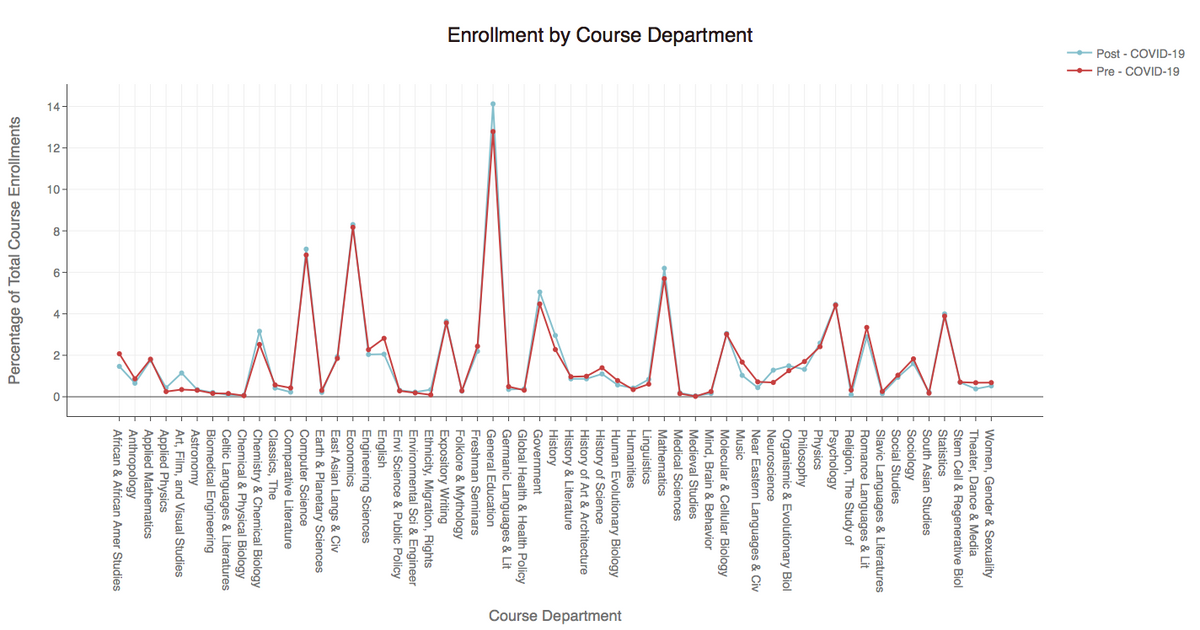
In the graph above, we take a closer look at course summary data as divided by department. For each department, we calculated the proportion of students enrolled in courses from that department as a fraction of the total number of “enrollments.” Supporting what we saw from the charts above, the overall data in this graph appears to indicate little difference between course enrollments before and after the start of the COVID-19 pandemic.
To help visualize any possible changes, in the graph below, we plot the difference between the percentage of enrollments post-COVID-19 and that pre-COVID-19 for each course department.
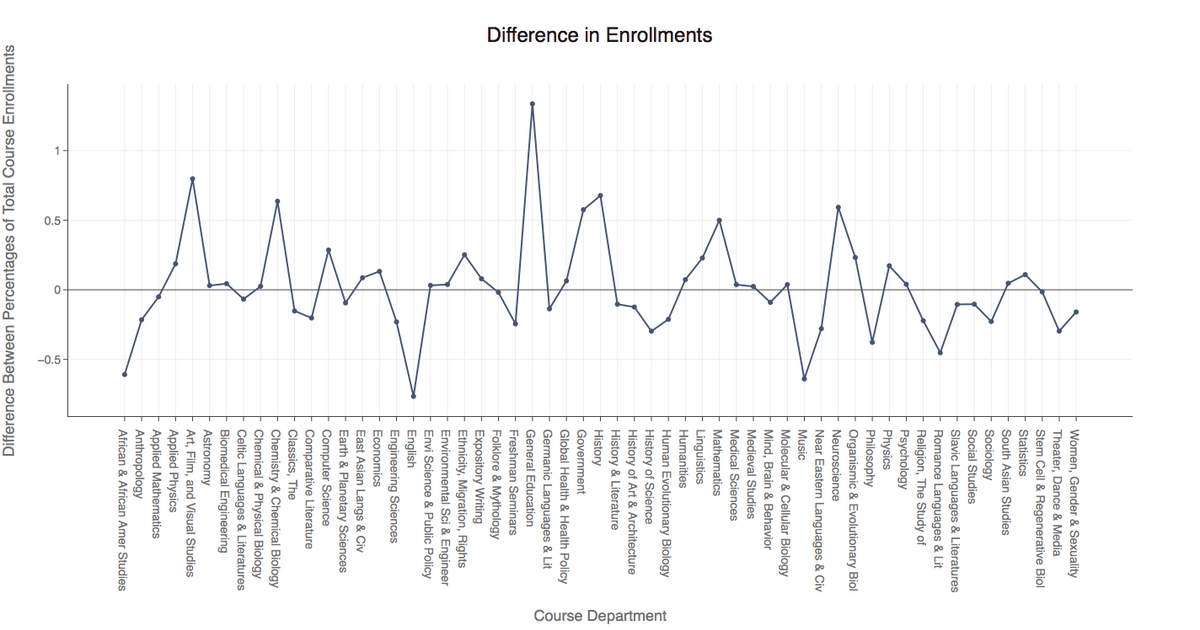
From this graph, we can see that:
- Courses in fields such as African and African American Studies, English, and Music saw the greatest drops in enrollment.
- On the other hand, General Education courses increased the most in popularity, with courses in Art, Film, & Visual Studies, History, Chemistry and Chemical biology, and Neuroscience following.
- Overall though, with the exception of General Education courses, changes in enrollment were very slight.
While COVID-19 and the shift to remote learning likely had some influence on students’ course selection, it is unlikely that it drastically affected the courses students ultimately enrolled in, especially given the variety of other factors taken into consideration when making this decision.
Was there an effect on enrollment in graduate-level courses?
Besides looking at the subjects of courses selected by students, we thought it might also be interesting to look at the difficulty of courses students decided to enroll in. While there wasn’t a direct method of categorizing by difficulty level with the data we had, splitting courses into undergraduate and graduate courses provides a rough estimate of course selection trends based on difficulty level, as graduate courses are typically more difficult than undergraduate-level courses. For this reason, we hypothesized that the number of undergraduate course enrollments in graduate-level courses might be lower this semester, as students may be more likely to seek less challenging courses as they face the pandemic and adjust to college online.
In a future study, it would be interesting to look at other factors besides course number that may indicate difficulty level, for example, average workload reported on the Q Guide or comments from course feedback.
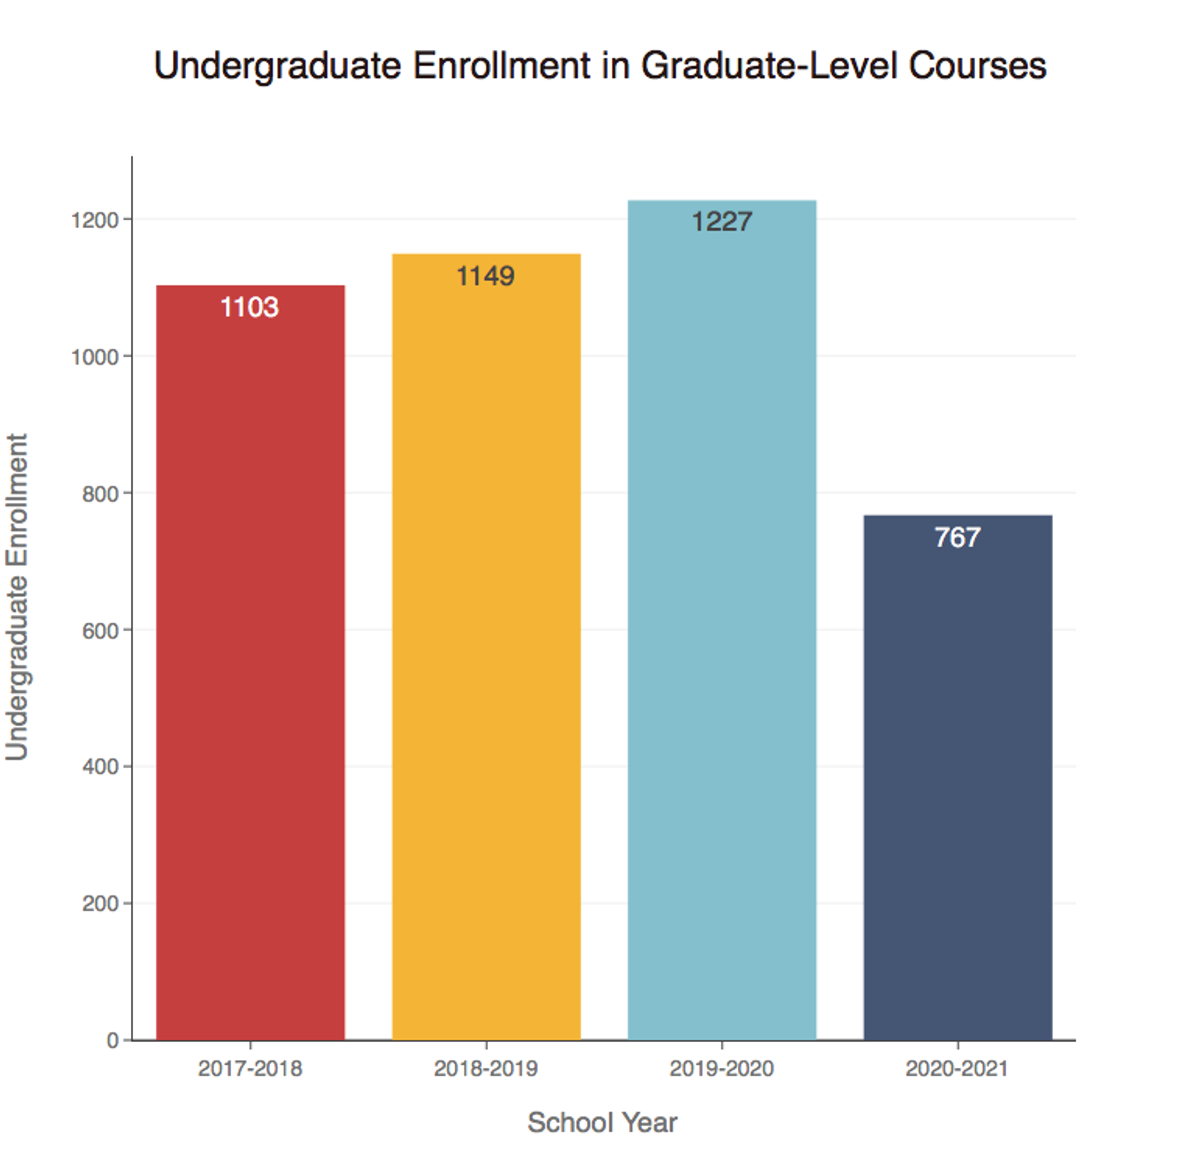
The graph above illustrates the number of undergraduate enrollments in graduate-level courses over the past four years. For this graph, we consider all courses in the ranges 200-299, 300-399, 2000-2999, and 3000-3999 to be graduate-level courses. Notably, while the total number of undergraduate enrollments in graduate courses remained at over 1000 from fall 2017 to spring 2020, that number dropped to below 800 this past school year.
Some possible explanations for this number include:
- Due to the news of remote learning and the pressures of and stress from the pandemic itself, students decided to take fewer of the more challenging graduate level courses.
- The large number of students on a gap year may have played a role in the decrease depicted. Since we are looking at absolute numbers, perhaps the smaller number of undergraduate students in graduate courses is due to the smaller overall population of students.
Unanswered Questions
Our analysis used course data from the FAS Registrar’s Office to gain insight into the way course enrollments were affected by COVID-19 and the shift from in-person learning to remote learning. As previously mentioned, because there were so many changing variables that likely had an influence on the data itself, it is impossible to determine from our analysis in this article itself whether or not the patterns we discussed were actually caused by COVID-19. Moreover, many of the differences we found between pre-COVID-19 and post-COVID-19 data were relatively small. We only looked at data from 2017 and later, covering just a few years before the start of the pandemic. Perhaps compiling data from earlier years could help us better understand the broader trends.
That said, there are a variety of directions further analysis could take. For example, it would be interesting to look at differences in changes in enrollment for classes based on class size, average workload, or past student evaluations. Have courses with different instruction styles (lecture-based, lab-based, flipped classroom, etc.) been affected by the changes of the past year differently? Looking at students, how have they adjusted the number of classes they’re taking, or the distribution of classes they’re taking among different subjects?
Conclusion
In this article, we examined possible influences of the COVID-19 pandemic and the resulting shift to remote learning on course enrollments at Harvard. There are some differences in course enrollment based on subject and then course department, with certain courses, General Education especially, growing in enrollment numbers, and others decreasing. Undergraduate students also appeared to have overall fewer enrollments in graduate-level courses this past year. These results suggest that, while only one of many factors, the COVID-19 pandemic and its effects did influence, to some extent, students’ selection of courses for the 2020-2021 school year.