

Budget and Salaries in Cambridge
How are Cambridge’s salaries reflected in its budget?
Budget and Salaries in Cambridge
How are Cambridge’s salaries reflected in its budget?
Introduction
In this project, we aimed to analyze how the distribution of salaries in Cambridge, MA aligns with the city's overall budget priorities in Fiscal Year 26 (FY26) across its major services. Sourcing data published by the Cambridge government, we compared Cambridge’s FY26 Adopted Budget to the salaries of its employees in each service.
Cross-referencing the FY26 budget priorities and salaries is vital for efficient allocation of resources and ensuring that Cambridge’s goals are being met, especially with new initiatives such as universal preschool with major amounts of funding up to a $12 million increase, targeted towards early childhood education (FY25 Adopted Budget). Yet, in addition to Cambridge’s investments in education, the city has also been perpetuating previous projects, such as providing affordable housing to ameliorate homelessness (Commonwealth of Massachusetts). By analyzing the salaries of Cambridge employees to determine whether or not the FY26 budget priorities are being met, Cambridge officials and locals can pinpoint any potential issues and decide future courses of action. This investigation helps improve community welfare and awareness by identifying the effectiveness of budget allocation and providing insights into the areas of greatest need.
Methodology
Working in Deepnote, we utilized Cambridge’s publicly available data on their Budget - Salaries and Budget - Operating Expenditures files in their Open Data Portal. In the salaries data file, the data provided by the city government includes Fiscal Year, Service, Department, Division, Position Number, Job Title, and Total Salary. After an initial analysis of the data, we filtered through the data to include three key categories: Fiscal Year, Service, and Total Salary for the sake of overall consistency.
In the operating expenditures file, the services are Human Resource Development, Education, General Government, Community Maintenance and Development, Public Safety, and Intergovernmental. The intergovernmental service has the smallest budget, containing only general expenses used by Cambridge’s local government with no employees. Therefore, we removed it from our data since it has no employees or salaries.
Furthermore, in order to make a comparison between the FY26 Budget and Salary data and analyze the most recent data, we decided to focus solely on FY26 even though the website reports data from 2017 to 2026, as the budget priorities and salary distribution have changed greatly throughout each fiscal year.
Findings and Analysis
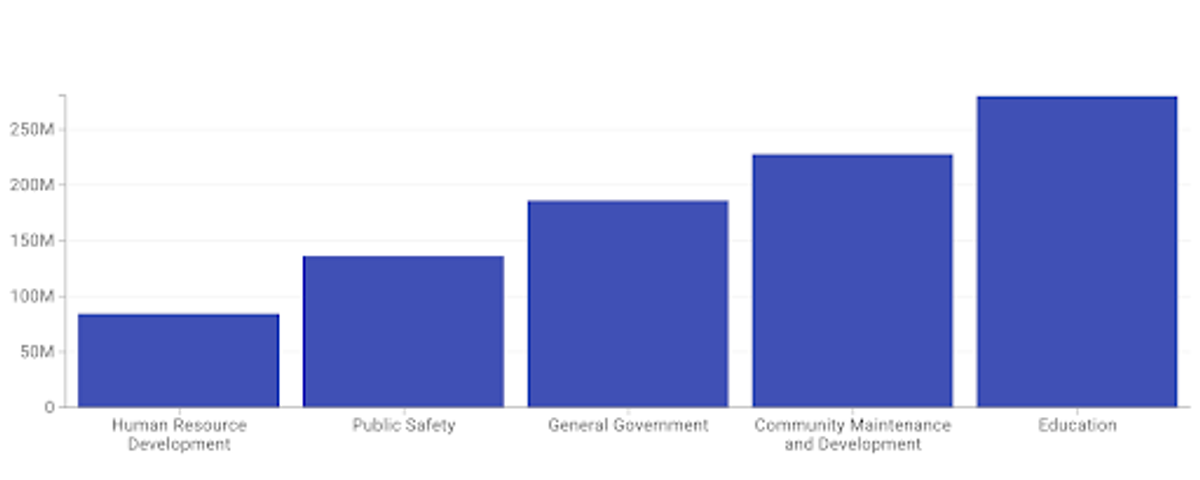 Figure 1: Total Budget by Service
Across the services, Education has the highest total budget (~$280M), with Human Resource Development having the lowest total budget (~$85M). This is well reflected in the FY26 Adopted Budget plans related to numerous initiatives and such as the universal preschool program previously referenced.
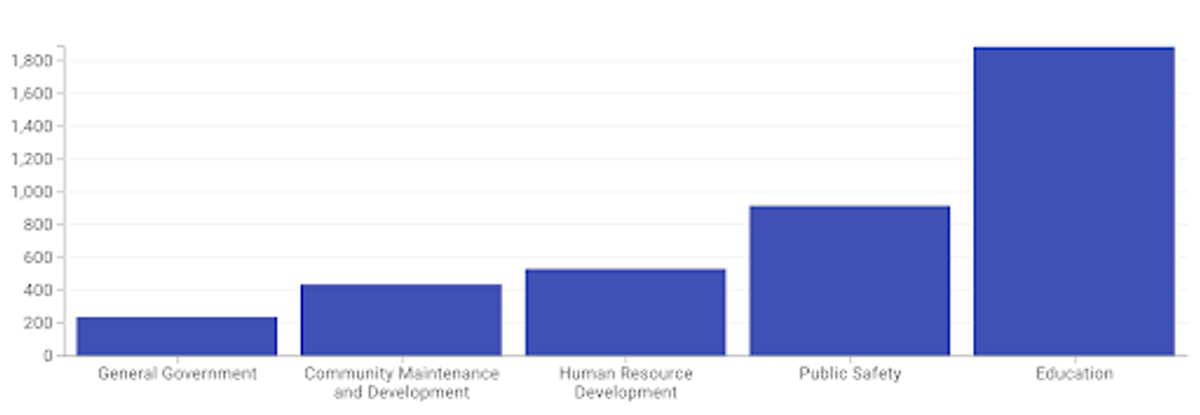 Figure 2: Number of Jobs in Each Service
Some reasons why the total budget and total salary are not a one-to-one correlation could include the nature of each service. For instance, it would make sense for there to be more education-related jobs since teaching fundamentally requires human resources at its core (~1900 positions). Similarly, a service like general government requires fewer positions (~250 positions), leading to a decreased total salary. The total salary and number of jobs in each service correlate much more closely than with the total budget, as only Community Maintenance and Development and Human Resource Development have switched positions.
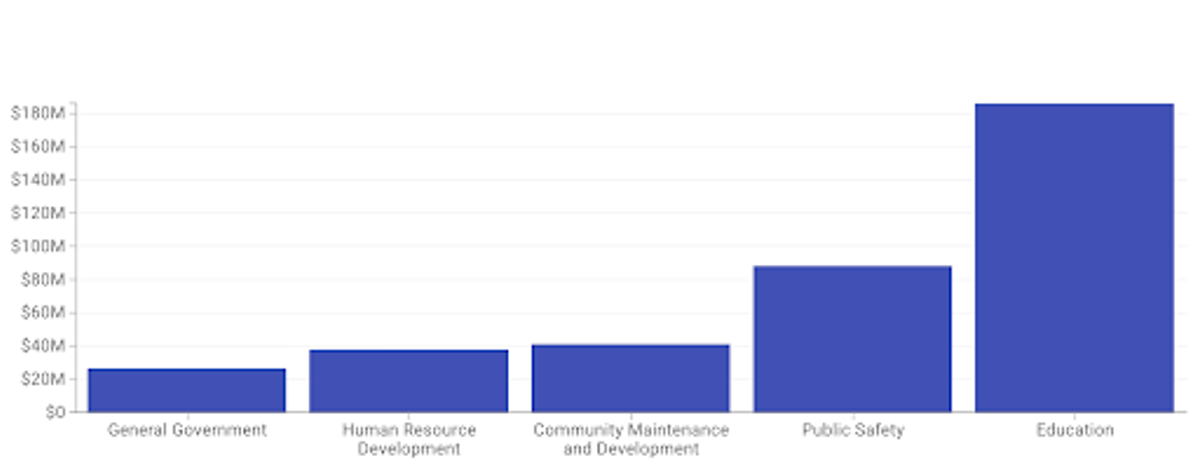 Figure 3: Total Salary by Service
Similarly, when it comes to total salary, Education has the highest total salary (~$185M), mirroring the total budget dataset. However, the other services are not in the same order of budget allocation, suggesting that salary may not always be the highest priority when it comes to the budget. For instance, while Public Safety has the 2nd lowest budget allocation (~$135M), it has the second-highest salary allocation (~$90M). This indicates that while salaries can be reflective of budget priorities, they don’t necessarily go hand in hand.
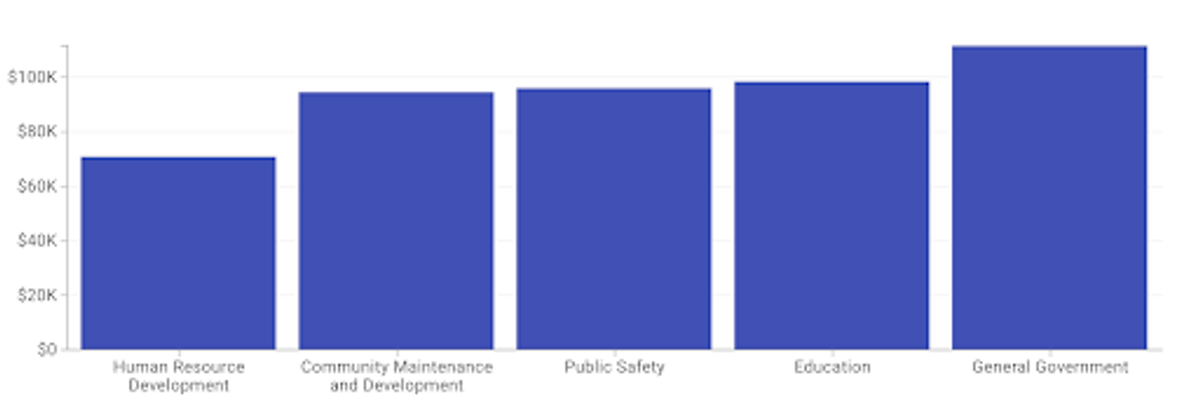 Figure 4: Average Salary of an Individual in Each Service
However, it should be noted that upon further analysis, the trends of individual salaries differ greatly compared to those of the major services as a whole. While there is quite a significant disparity between total salary and budget across the different services, on the individual level, the average salary is more balanced on the whole, ranging from yearly salaries of ~$70K to ~$110K. In fact, despite having the lowest total salary, the General Government service has the highest average salary (~$110K).
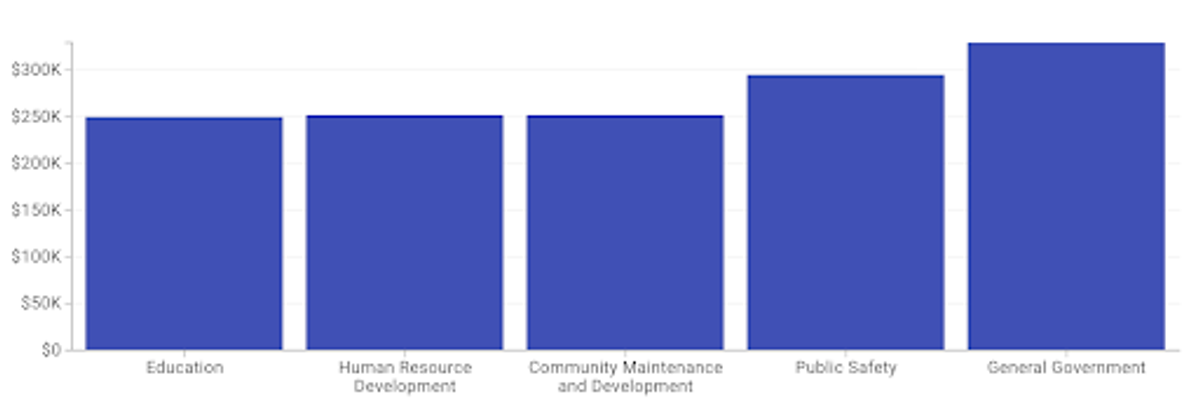 Figure 5: Maximum Individual Salary of Each Service
Similarly to the average salary of an individual in each service, the Maximum individual salary is within a comparable range of each other, demonstrating that on the individual level, salary is generally not majorly distinguished by service.
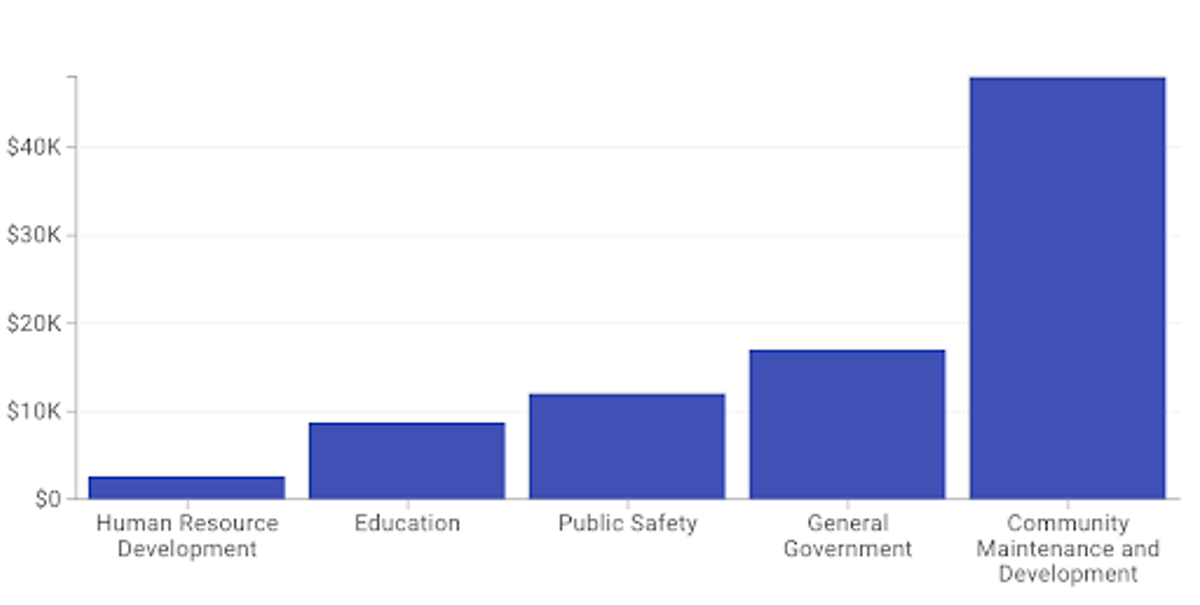 Figure 6: Minimum Individual Salary of Each Service
However, there are drastic differences when it comes to the minimum salary of an individual in each service. This could be due to multiple differences, such as the difficulty and exclusivity, further reinforcing that salaries are not necessarily correlated with total budget.
Conclusion
Investigating the correlation between Cambridge’s budget priorities and salary distributions is crucial to analyzing the general trends within the different service categories and determining the general welfare of individual workers in Cambridge. By determining how budget priorities do or do not influence salary distribution, Cambridge can better determine how to allocate salaries and ensure that workers' standard of living is being met. Overall, while budget priorities and salary distributions are not directly proportional, forming a comparison between the two gives valuable insights into patterns and individual well-being.