

Analyzing College Prestige and Virality Through Google Trends
Another reason to choose Harvard over Yale.
Introduction
To every Yalie’s dismay, we provide more statistical evidence than ever to support choosing to attend Harvard because “it is, well, Harvard.” In this article, we review the results of using our upgraded Google Trends API, Google Search scraper, and learning algorithm to investigate the relative prestige of various institutions and the cultures therewithin.
In this article, we first discuss the motivation and methodology of our upgraded Google Trends API. We then present 1) the results of the time-series interest of National Universities, 2) clusterings of viral keywords related to Harvard and MIT, and 3) the application of our technique to predict Netflix’s net subscriber additions, a common predictor of stock price.
We report that Harvard ranked first in domestic and international search traffic this past year compared to Stanford, MIT, and the rest of the Ivy League. Over a five year period, Stanford only outranked Harvard in 2016, and not for reasons that Stanford would be proud of. Perhaps most importantly, Harvard had more than twice as much search traffic as Yale internationally and close to twice as much domestically. Compared to MIT, people searching for Harvard in Boston more often searched for peer institutions, botany, ramen, and Mount Auburn — whereas people searching for MIT showed more interest in Jeffrey Epstein, Brad Pitt, and, surprisingly, the gym.
Methodology
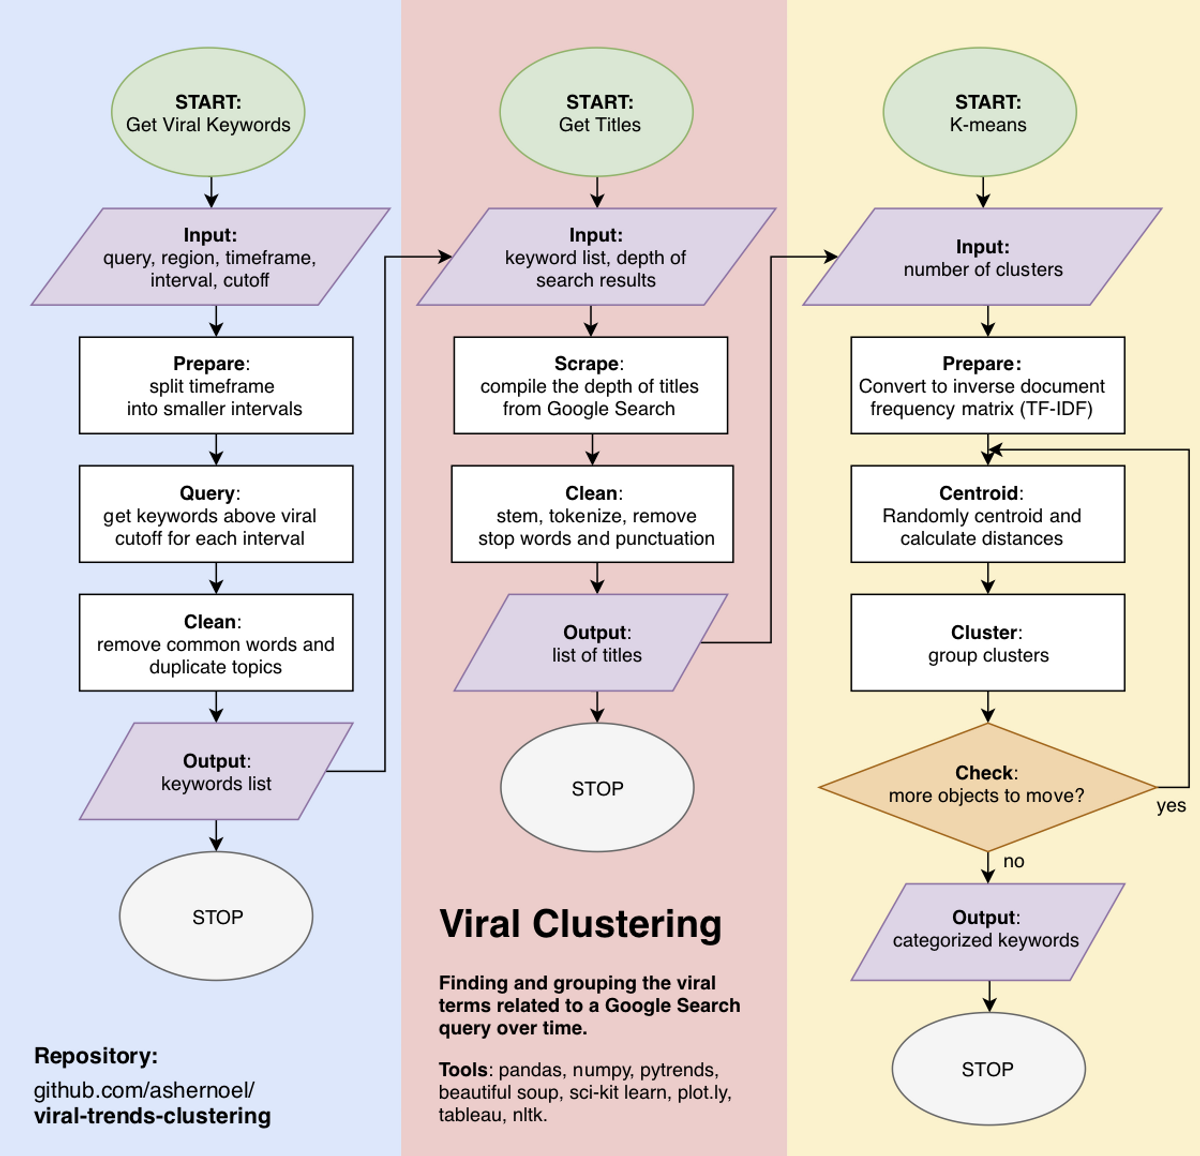
Google Trends provides robust data about the cultural interests of human populations, but it is limited: Google does not support a public API, and its two private research API’s are limited to 5 and 30 keywords per query, respectively.
To remedy this, we first upgraded a Google Trends scraper to accommodate theoretically infinite keywords per query. We then created a function that returns a list of all “viral” topics related to one query over a time period, where a “viral” topic is defined to be one that increased in search traffic volume a specified percentage over a controllable smaller time interval. Finally, we clustered these keywords into groups by applying a k-means learning algorithm to term frequency-inverse document frequency (TF-IDF) vectorized data, which reflects the relative importance of each word, scraped from Google Search. All of our code is viewable and documented on GitHub.
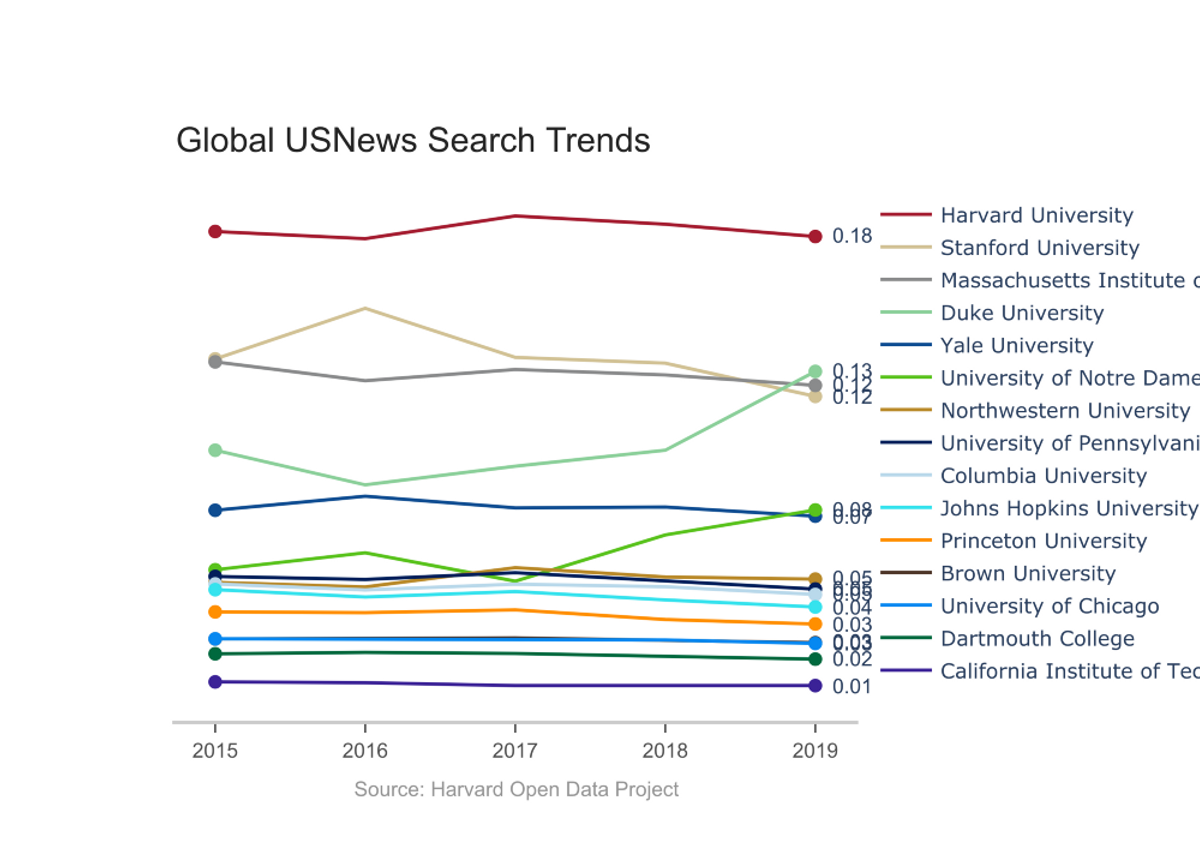
College Prestige
To investigate college prestige, we averaged and normalized search interest over time for select universities in the United States and globally for each year from 2015 until 2019. Because Google normalizes all searches relative to the total search volume, our normalization lets us compare searches relative to one another.
To start, we looked into the relative interest in HYPSM, a term that refers to Harvard, Yale, Princeton, Stanford, and MIT:
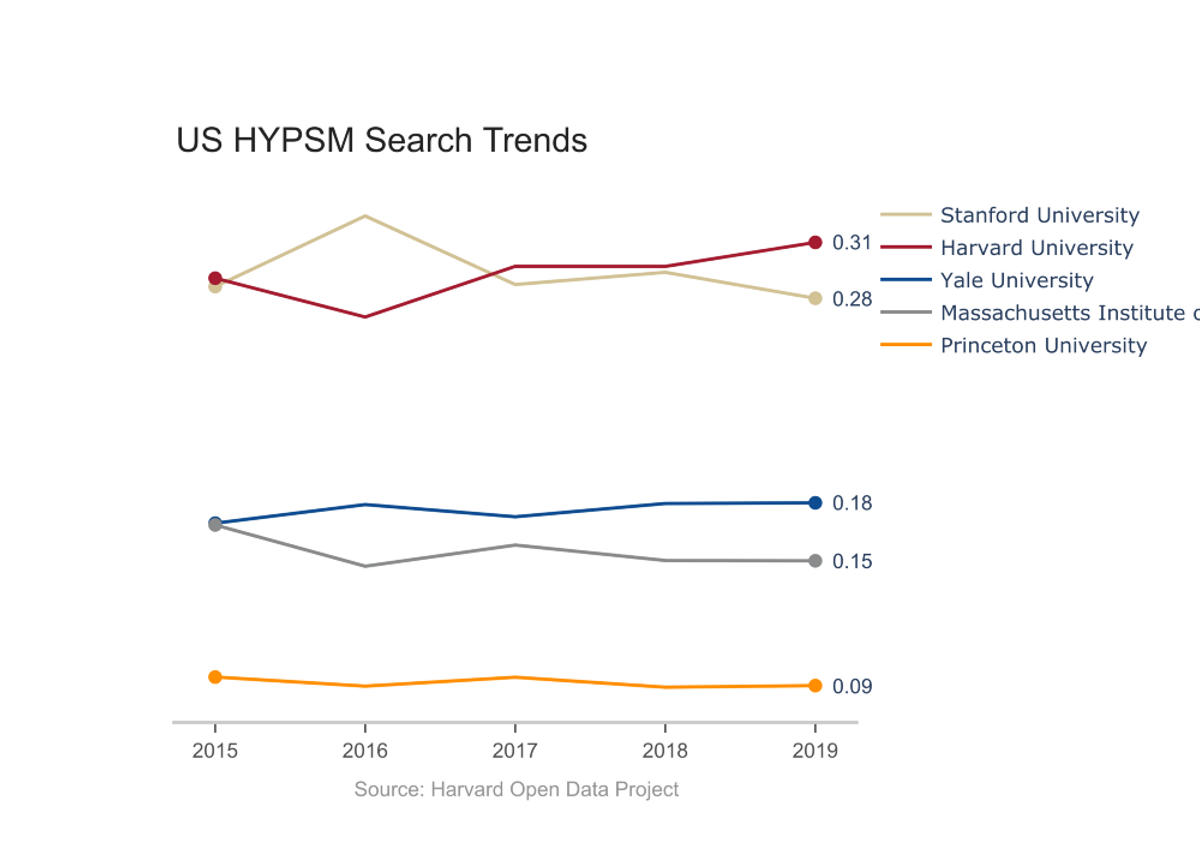
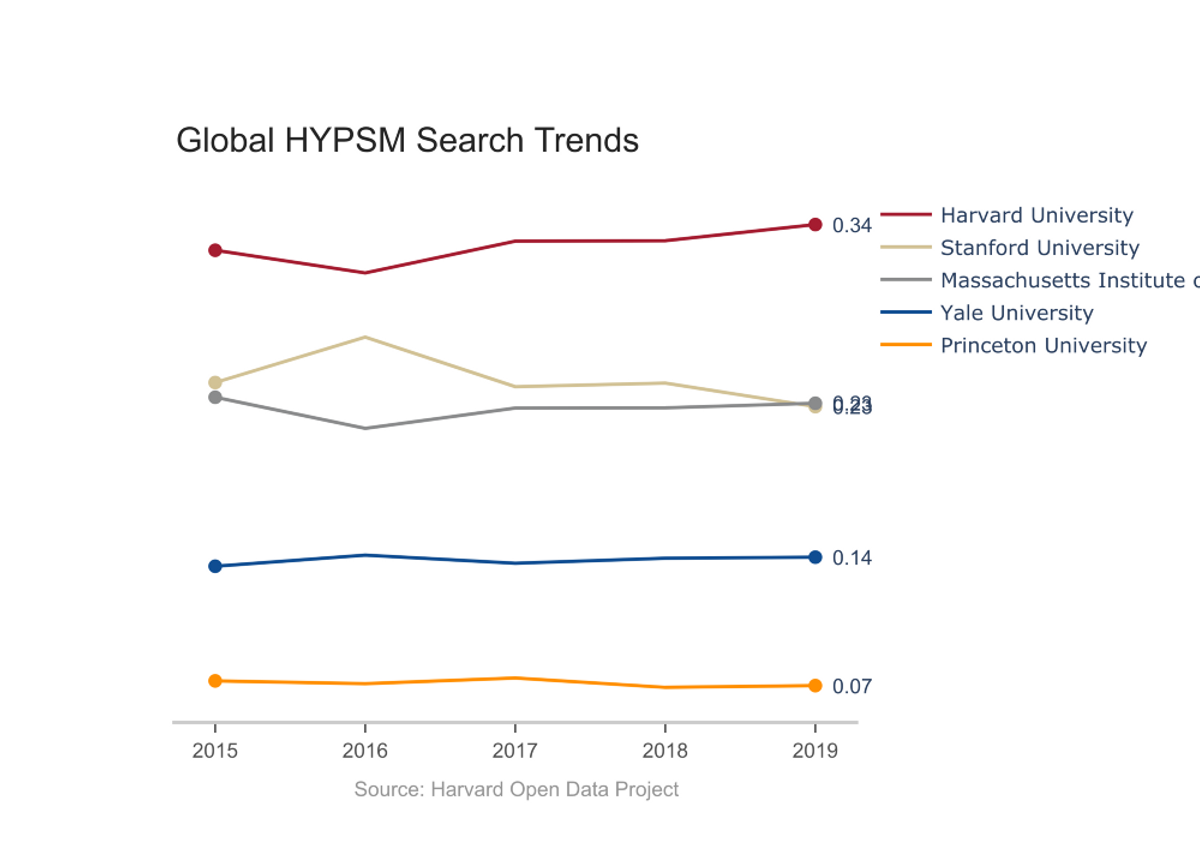
While Stanford outranks Harvard domestically on average over the past five years, Harvard leads globally. Harvard is also the leader for 2019 both domestically and globally. For the most part, the constancy of the search volume suggests that these trends reflect long standing differences in cultural interest in the universities and not current events or the Affirmative Action lawsuit. However, there are two abnormal features: 1) Stanford’s 2016 spike, and 2) Princeton’s low volume.
Stanford’s surge can be attributed to the public outrage following the reveal of Brock Turner’s six-month sentence and the incredible virality of Chanel Miller’s 7,244 word account of her experience with sexual assault, which recieved over five million views in three days. A visualization of Stanford’s search volume during the summer of 2016 can be found here.
On the other hand, Princeton’s lower than expected search volume, especially for the school ranked 1st according the US News and World Report, results from our analyses comparing time-series ‘search topic’ volume, not ‘search term’ traffic. If an individual ‘search term’ garners enough traffic, Google categorizes it into a ‘search topic’ to differentiate it from other queries. For example, while the ‘Brown University’ topic is reasonably placed compared to other topics, the traffic of the lone search term ‘brown’ far exceeds that for the keywords of the other ivies. For most keywords, the distinction between topic and search term does not make a visible difference in the volume; however, in Princeton’s case, the existence of multiple cities named Princeton across the United States, where usage of the “Princeton” term spiked (link to Princeton search results by region), inflates the search traffic relative to the search volume. As such, Princeton University really does have less search interest than its rankings suggest.
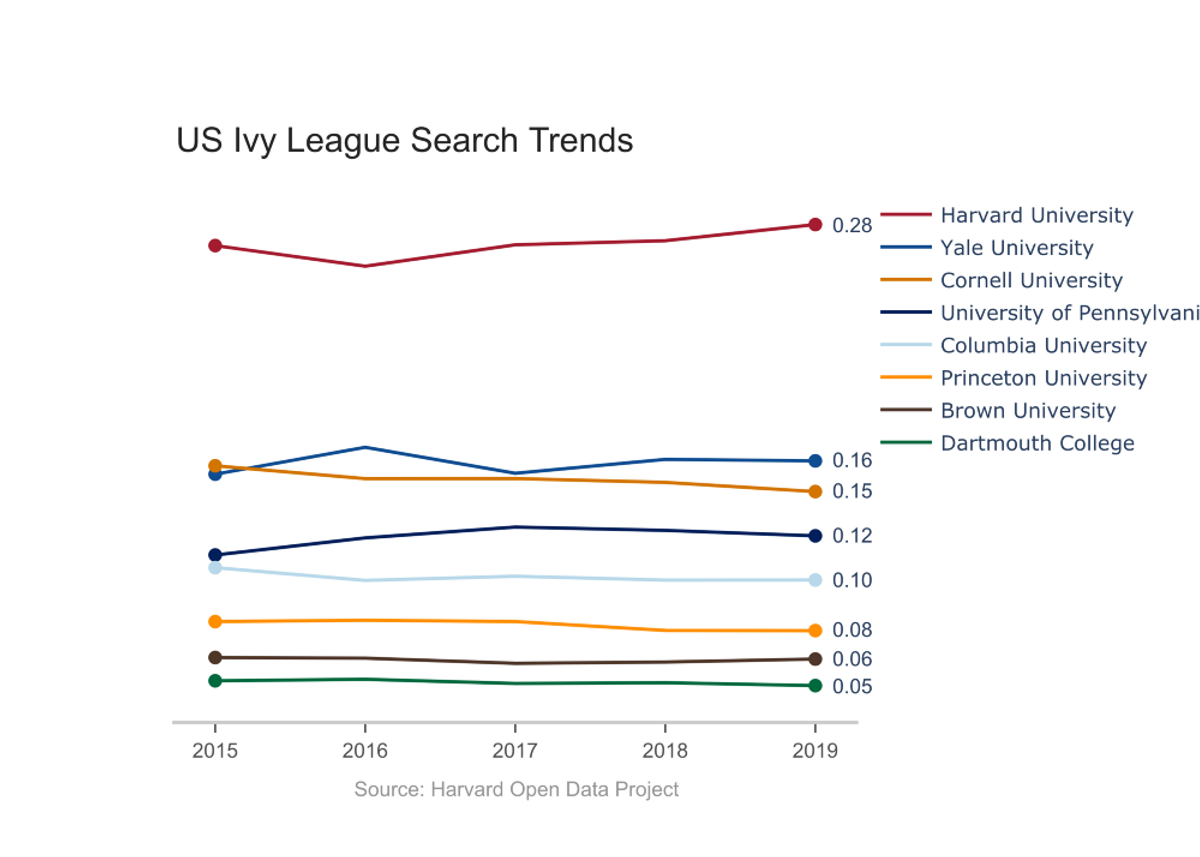
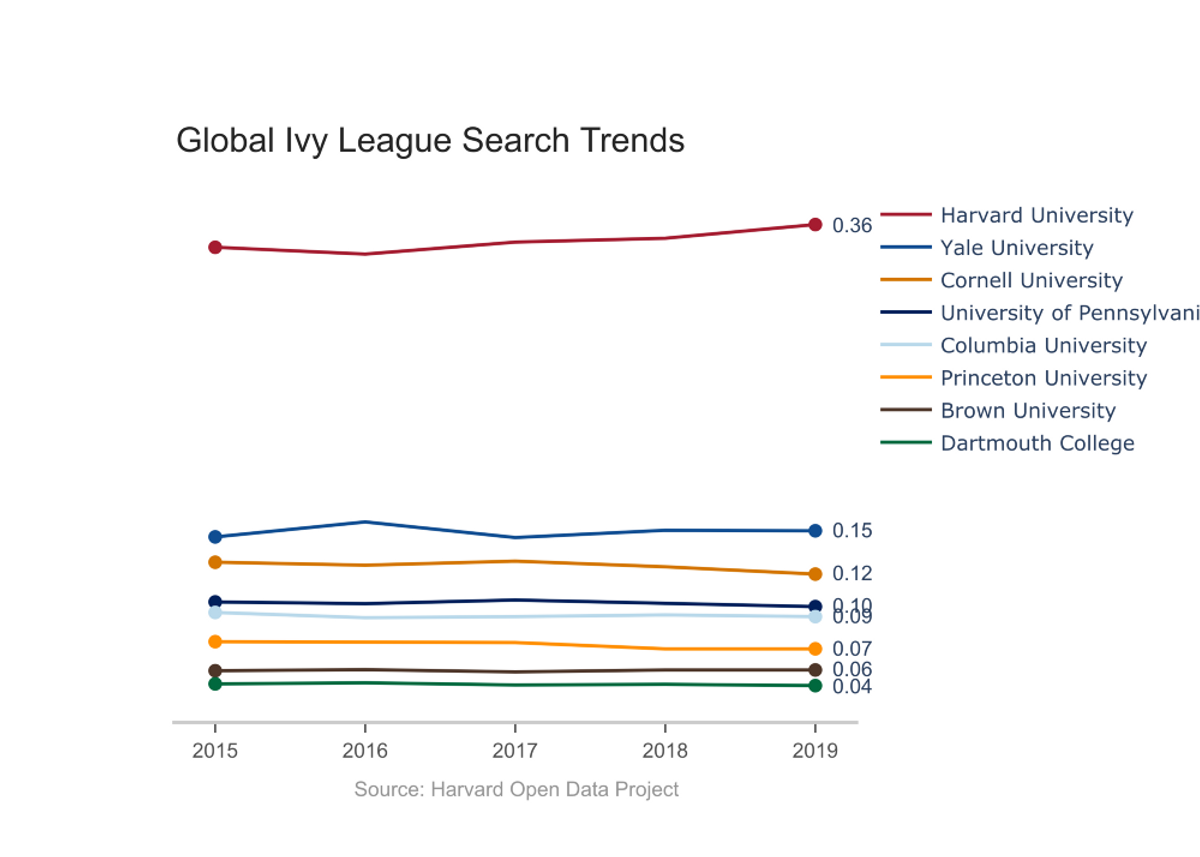
Next, we utilized our upgraded API’s ability to query infinitely many key terms and compared the entirety of the Ivy League. While the US News & World Report rankings suggest that Harvard can be grouped with the other ivies, the trend data shows that Harvard exists in a league of its own. Internationally, the difference is only accentuated. With this large cultural difference in mind, it may be justified to choose Harvard because “it is, well, Harvard.”
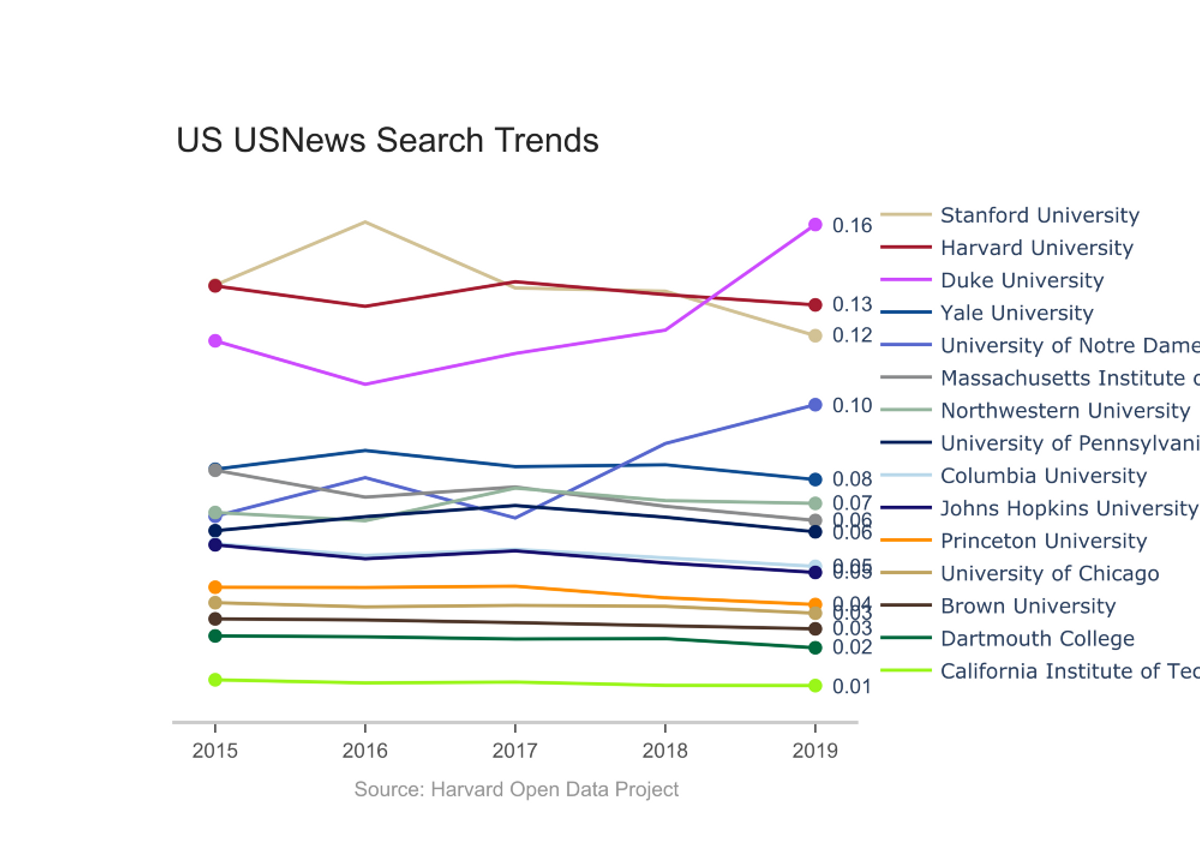
To round out our investigation, we visualized trend data for all of the top 15 National Universities according to U.S. News and World Report, many of whom were a part of our earlier analyses. Two observations stood out:
Schools with strong sports teams, such as Duke University, Notre Dame, and the University of Michigan: Ann Arbor, saw substantial increases in traffic during their flagship sport’s respective season. This inflated the numbers for these institutions relative to more academically focused institutions, such as Caltech or the University of Chicago.
Additionally, search volume seemed related to the size of the institution, with schools such as the University of California: Los Angeles and Cornell University garnering more search interest than otherwise expected compared to smaller undergraduate-focused schools like Dartmouth and Princeton. While raw search volume is an interesting metric, we recommend that future investigations look into volume per student to reveal more information about a university’s prestige.
Harvard may lead other colleges internationally in search volume, but our analysis shows that, for most schools, search volume is more strongly associated with cultural presence and institution size than it is with prestige. However, few other schools, if any, had as broad of an array of “viral” terms, from “Lil Pump” to “Dropping Out” to “Kim Kardashian” to “Botany,” as Harvard.
Virality Clustering
After analyzing raw search volume over time, we then moved beyond interest to look at the behavior and nature of keywords representing topics related to queries.
We defined a “viral” keyword to be a keyword that increased a specified amount over a specified time period related to the original key word. A related keyword had to increase in search traffic over 1,000% over a time interval of 15 days to be considered “viral.”
For each institution, we ran a given keyword, along with other inputs seen in the purple parallelograms in the diagram below, through three functions to arrive at distinct clusters of phrases and words related to the original keyword. A flowchart describing the Viral Clustering algorithm is shown below:
To make sense of the results of the variable Google Search results and clusterings, we compared Harvard University’s viral clusters to MIT’s. Labeled clusters, as well as some terms for each, are shown in the following figures:
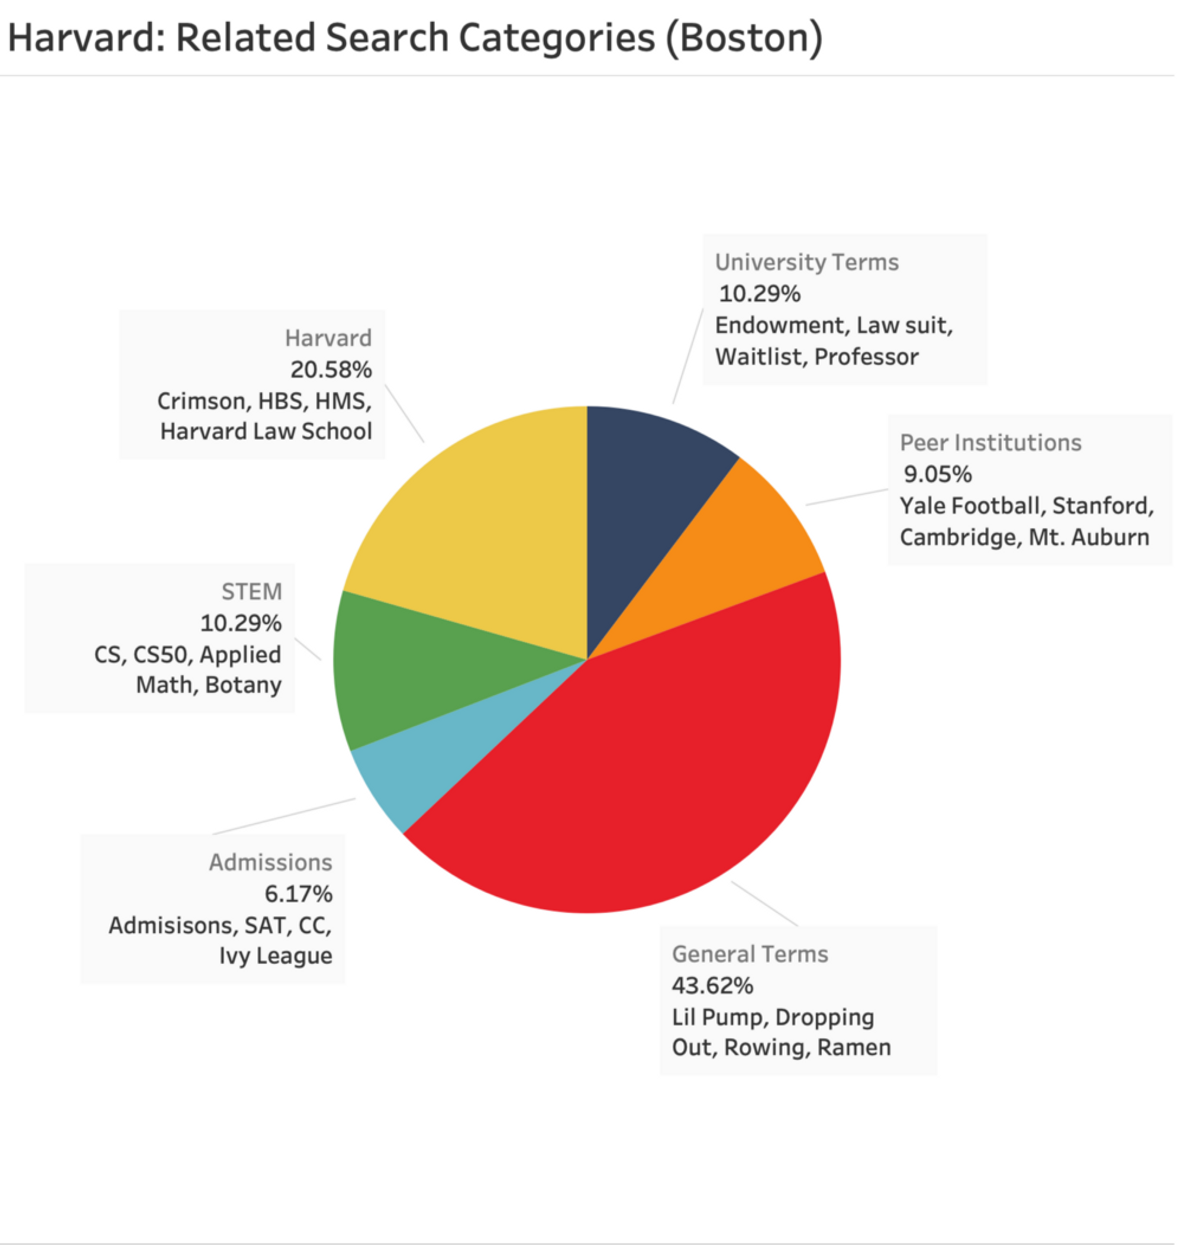
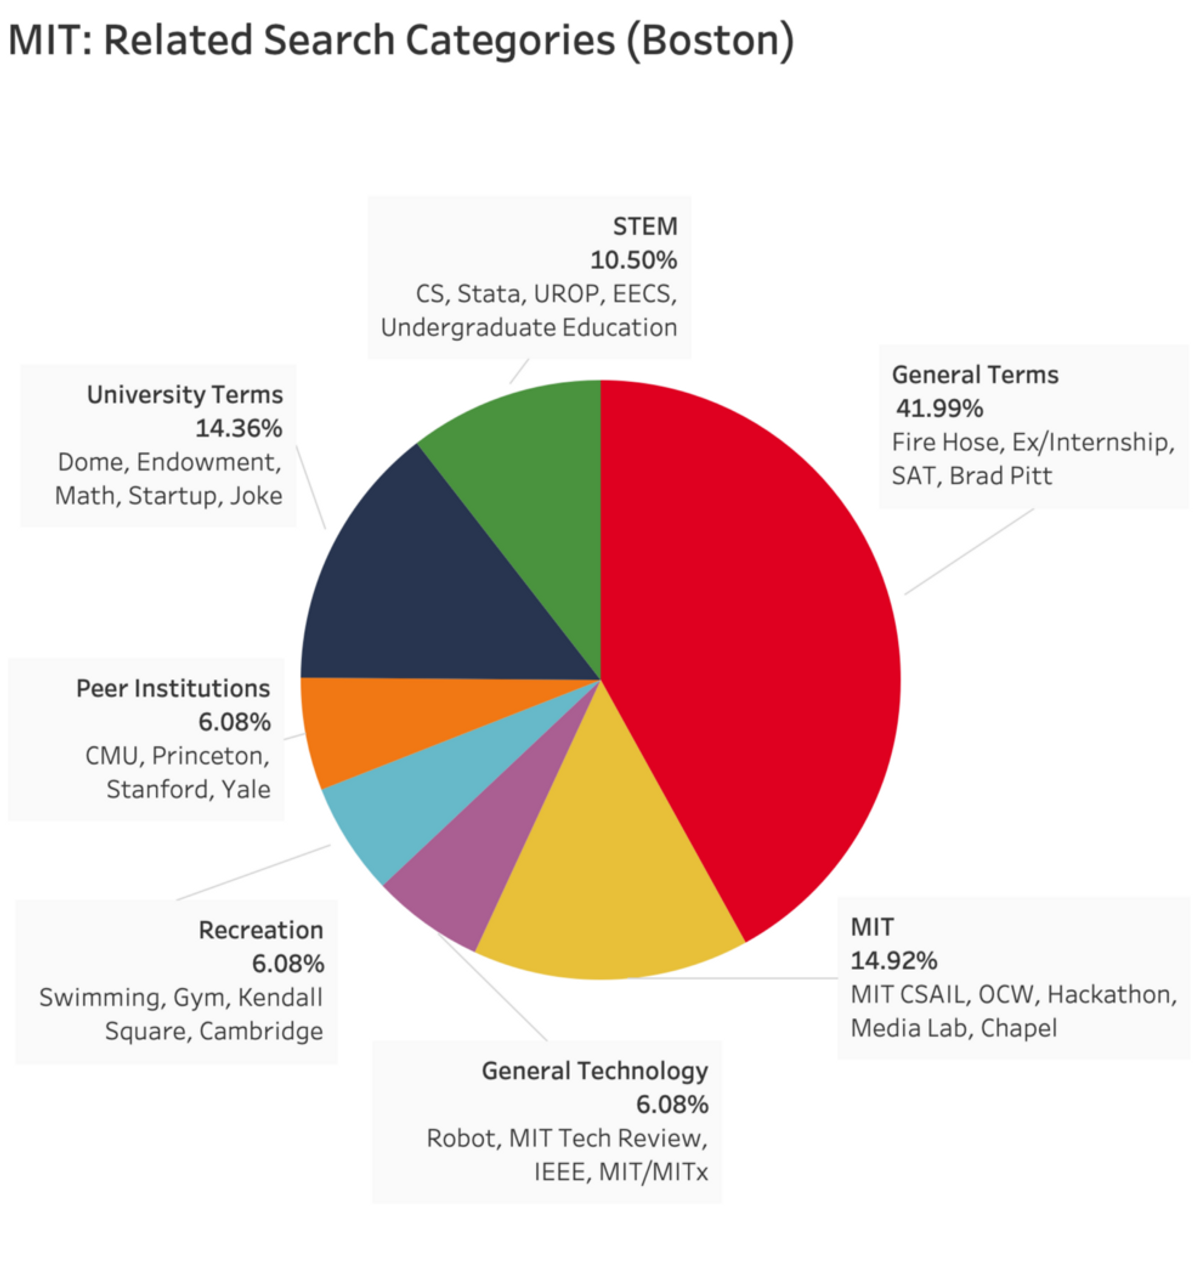
When considering Harvard’s results alone, we posit that the variety and breadth of Harvard’s “General Terms” indicates how Harvard maintains such a large cultural presence. Comparing Harvard to MIT, we suggest that differences reflect cultural differences between the two institutions:
While about 10% of viral queries were categorized together and manually labeled as ‘STEM’ for Harvard, MIT’s STEM related categories include an 11% ‘STEM’ category, a 6% ‘General Technology’ category, and much of the 15% of terms constituting the ‘MIT’ itself category. Similarly, while much of MIT’s ‘MIT’ cluster focused on STEM fields, such as MIT CSAIL and Hackathon, Harvard’s ‘Harvard’ cluster focused on a broader set of institutions: Harvard’s Medical School, Harvard’s Law School, and the Crimson, to name a few, reflecting the broader mission and culture of the University as a whole.
People searching for both schools expressed interest in Admissions; however, only in Harvard’s case did that traffic form its own cluster. Interestingly, people searching for Harvard were more likely to search for other peer institutions than people searching for MIT, with 9% and 6% of viral keywords being clustered into the ‘Peer Institutions’ category for each, respectively.
Although the two pie charts are comparable, this is somewhat of a coincidence: k-means is unsupervised, so the clusterings for each have different centroids. Going forward, it would be interesting to run these keywords and their Google Search results through a Naïve Bayes classifier or trained Convolutional Neural Network. With that said, the generality of unsupervised methods means that our code can be applied to any query, regardless of whether or not there is training data available, and that is powerful in its own right.
Implications and Conclusion
For years, people have whispered about Harvard’s unparalleled brand value, especially overseas and in relation to its historical rival, Yale. With the publishing of this article, we finally have quantitative data to substantiate those claims. Not only did Harvard’s search volume almost always surpass those of its peer institutions, it did so with room to spare, especially internationally. Yale may be Harvard’s historical rival, however, in the modern era, Stanford most lithely encroaches on Harvard’s prized domain. Meanwhile, MIT may have a more consistently STEM-centric culture, but Harvard’s related terms show breadth and diversity, one of the university’s highest values.
Our analysis helps to understand National Universities, but the scope of this project’s work is broader than educational institutions.
The universality of our upgraded Google Trends API means that it can be applied to answer questions in domains ranging from finance to anthropology. As an example of this, we compared Netflix’s global net subscriber additions, a strong predictor of stock price and performance, with the number of viral Google Trends topics, as determined by our algorithm, each quarter over a period of four fiscal years:
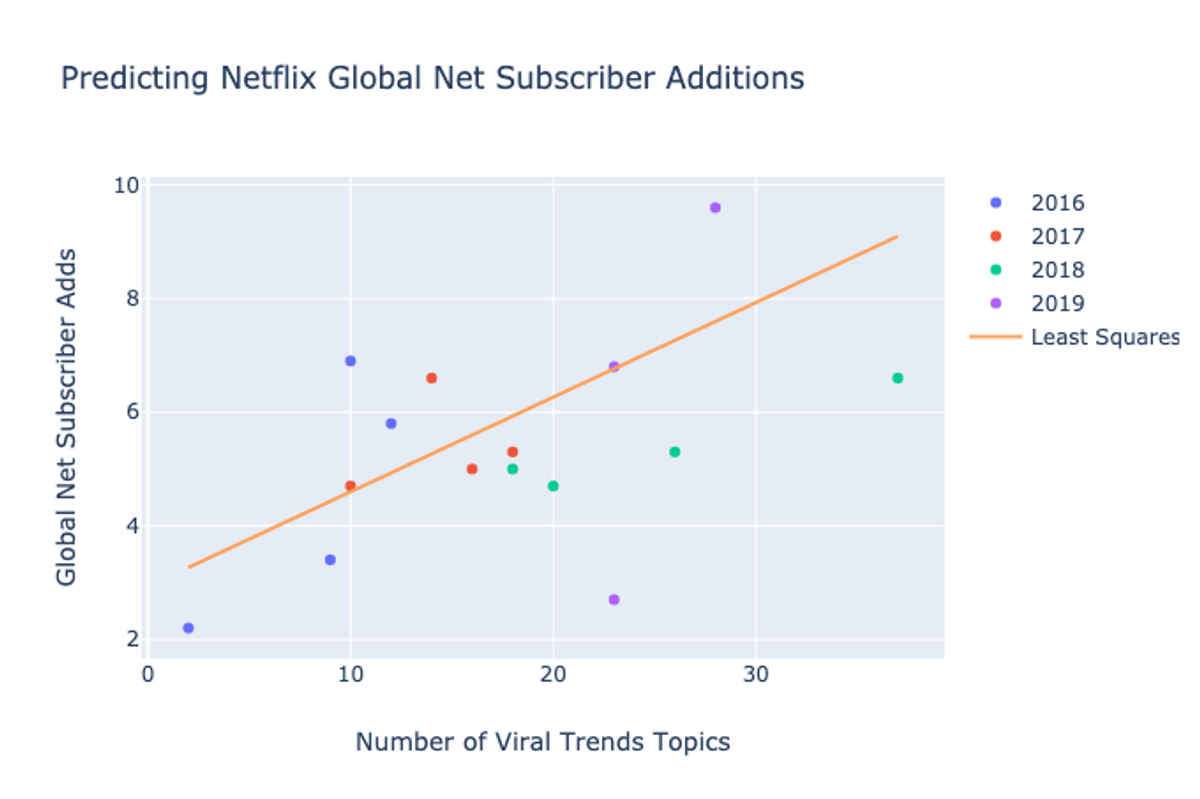
The correlation suggests that, while the exact parameters for our viral cutoff or viral time interval could be improved to increase fit, viral key term analysis proves insightful in areas unrelated to college and prestige.
Every day, Google Search handles the questions, whims, and anxieties of much of the human population. For most amateur programmers, the API is shielded from public use. But now, anyone can see not only what people are searching for, but also the related topics that Google Trends might not immediately reveal: the viral keywords, and their subsequent clusterings. Check out the API we built on GitHub.