
Analyzing HUDS Text Message Feedback
What do Harvard students think about HUDS, and has the recent Covid-19 Pandemic affected their thoughts about the dining service in any way?
Introduction and the Question
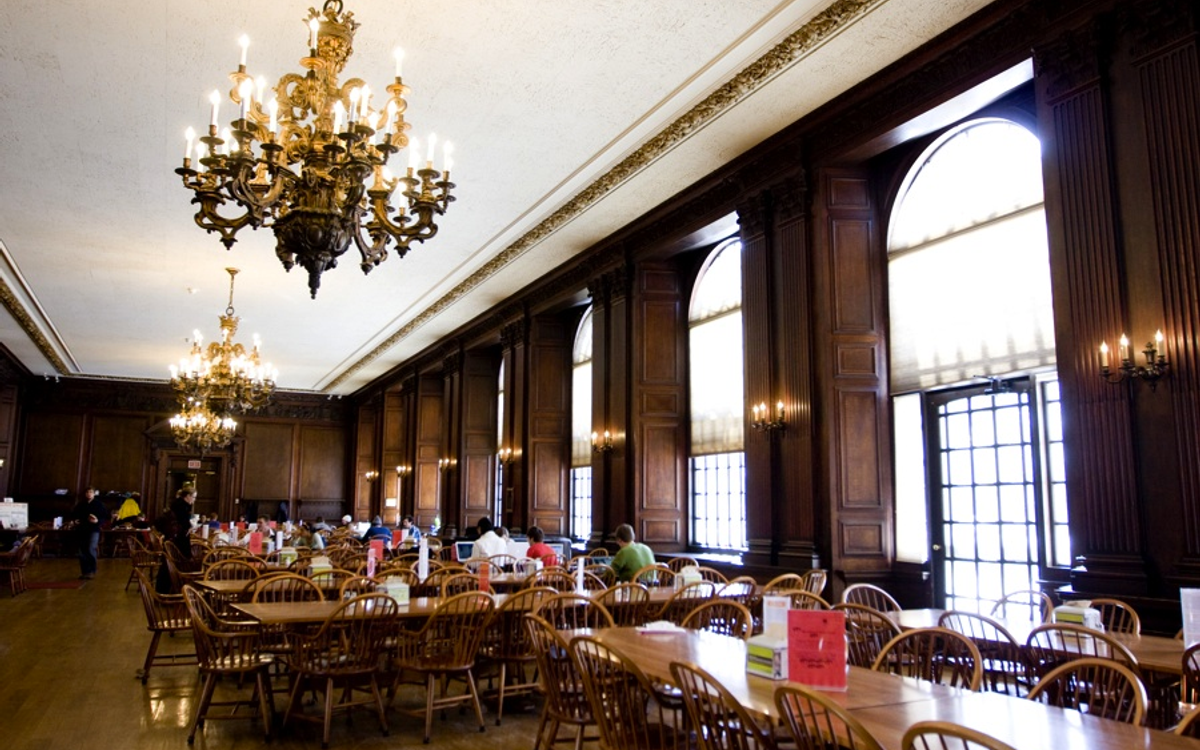
HUDS, the oldest collegiate dining hall service in America, has a steady presence on campus. They serve the first meal Harvard Freshmen consume at Annenberg, provide the sandwiches students snatch at Flyby ten minutes before class, and consistently ensure upperclassmen are fed in their respective houses. HUDS, in short, is a major component of the Harvard Experience. But what do Harvard students think about HUDS? And has the recent Covid-19 pandemic affected their thoughts about the dining service in any way?
In 2017, HUDS launched the “Text and tell” program so that Harvard students could text the dining hall with any feedback about the food and services. We analyzed the dataset containing the text messages sent to HUDS before the pandemic in October 2019, and after the pandemic in October 2021. We analyzed the sentiment of these datasets, as well as which houses the most feedback comes from and at what time of day. Note that the data are anonymized, so we cannot discern the identity of the students who sent the messages.
What is the sentiment of the HUDS text messages?
Using the NLTK library for Python, we analyzed the sentiment of all texts sent to HUDS before and after the pandemic. Sentiment is measured on a scale from -1 to 1, where -1 is the most negative and 1 is the most positive. Looking at sentiment overall, we can see that the 2021 texts are generally more positive compared to the 2019 texts (Figure 1).
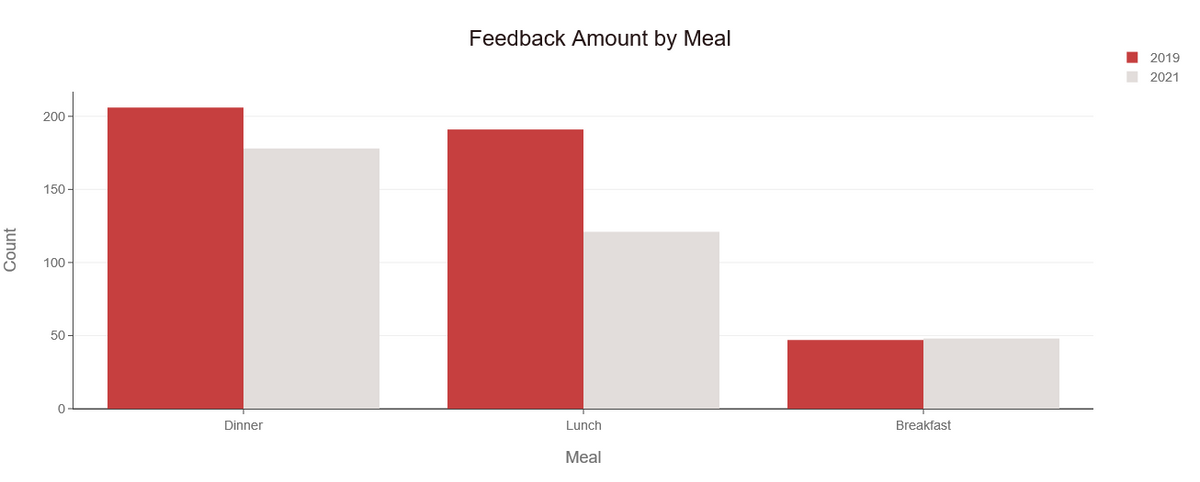 Figure 1
However, when breaking down sentiment by house, there seems to be more positivity in the 2019 texts when compared to the 2021 texts. This might seem odd at first, but the differing trends aren’t just an error in data collection. Here, we have an example of Simpson’s paradox, where the pooled data from earlier is skewed by specific trends in larger houses, but aren’t representative of the within-house change in feedback sentiment (Figure 2). For example, there is a large increase in positive sentiment in Kirkland from 2019 to 2021.
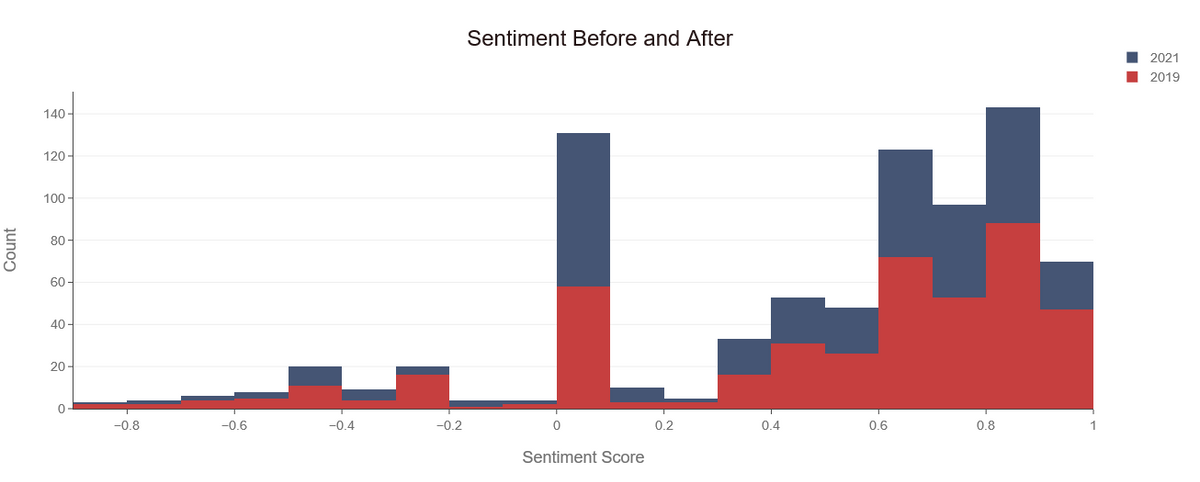 Figure 2
How much feedback do students give, and how has it changed after the pandemic?
When we split up the feedback quantity per house, with each year being represented by the same feedback from October, the eight dining halls with the most feedback across both years see a consistent drop in feedback, while the houses with less overall feedback show the reverse trend (Figure 3). One important note is the large decrease in feedback from Annenberg relative to the trend in other houses, which suggests a shift in student culture towards interacting and giving feedback to HUDS in the freshman class, while some of the students from 2019 are still eating at the houses in 2021. We also recognize that because the data is only from October, as that is the only month we could get data access to, the results could vary month by month.
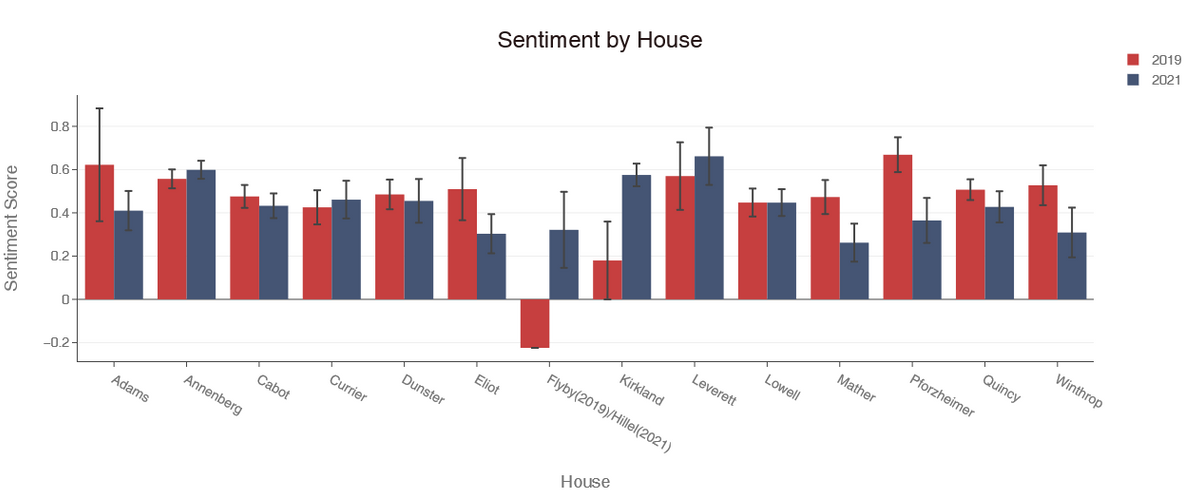 Figure 3
When do students tend to provide feedback?
Since the Text and Tell interface doesn’t ask for the meal in question, we set cutoff points during the day for when feedback about a meal would reasonably be submitted during. In this case, we defined breakfast as from 7:30 AM to 11:30 AM, lunch from 11:30 AM to 5 PM, and dinner from 5PM until 7:30 AM. One possible drawback of this method is that there is a greater overall time to submit feedback for dinner during typical student waking hours, and there is a chance that feedback for a non-corresponding meal shows up as dinner. In addition, Brain Break feedback, however minimal, would also fall into the dinner range. However, we still saw a negligible difference in feedback between lunch and dinner in both years, while breakfast unsurprisingly has the least amount of feedback (Figure 4). This is consistent with our expectations given the absolute number of students who show up at each meal.
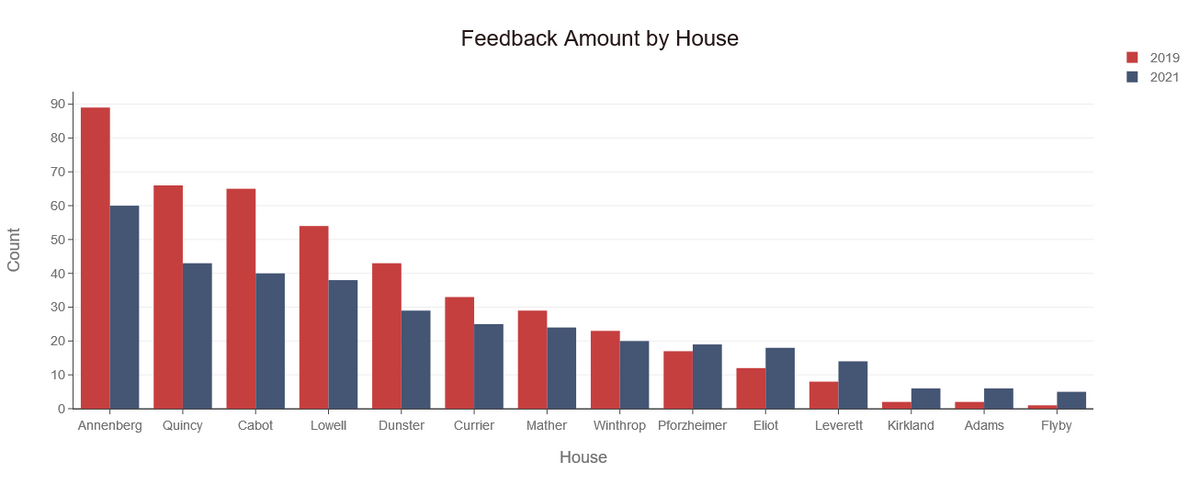 Figure 4
Does the type of feedback vary depending on the meal?
To test this, we calculated the average sentiment given to us by the NLTK library, and within the margins of error typical for language processing, there isn’t a particularly noticeable difference across meals, although one common trend shared across all meals is a slightly more negative tone after the pandemic (Figure 5). Note that this again is an example of Simpson’s paradox, where the data pooled by meal abstract away the effect of specific dining hall on feedback sentiment. One potential explanation for this is that certain kitchens, such as Annenberg, had to accommodate a larger number of students post-pandemic, as compared to changes in other houses.
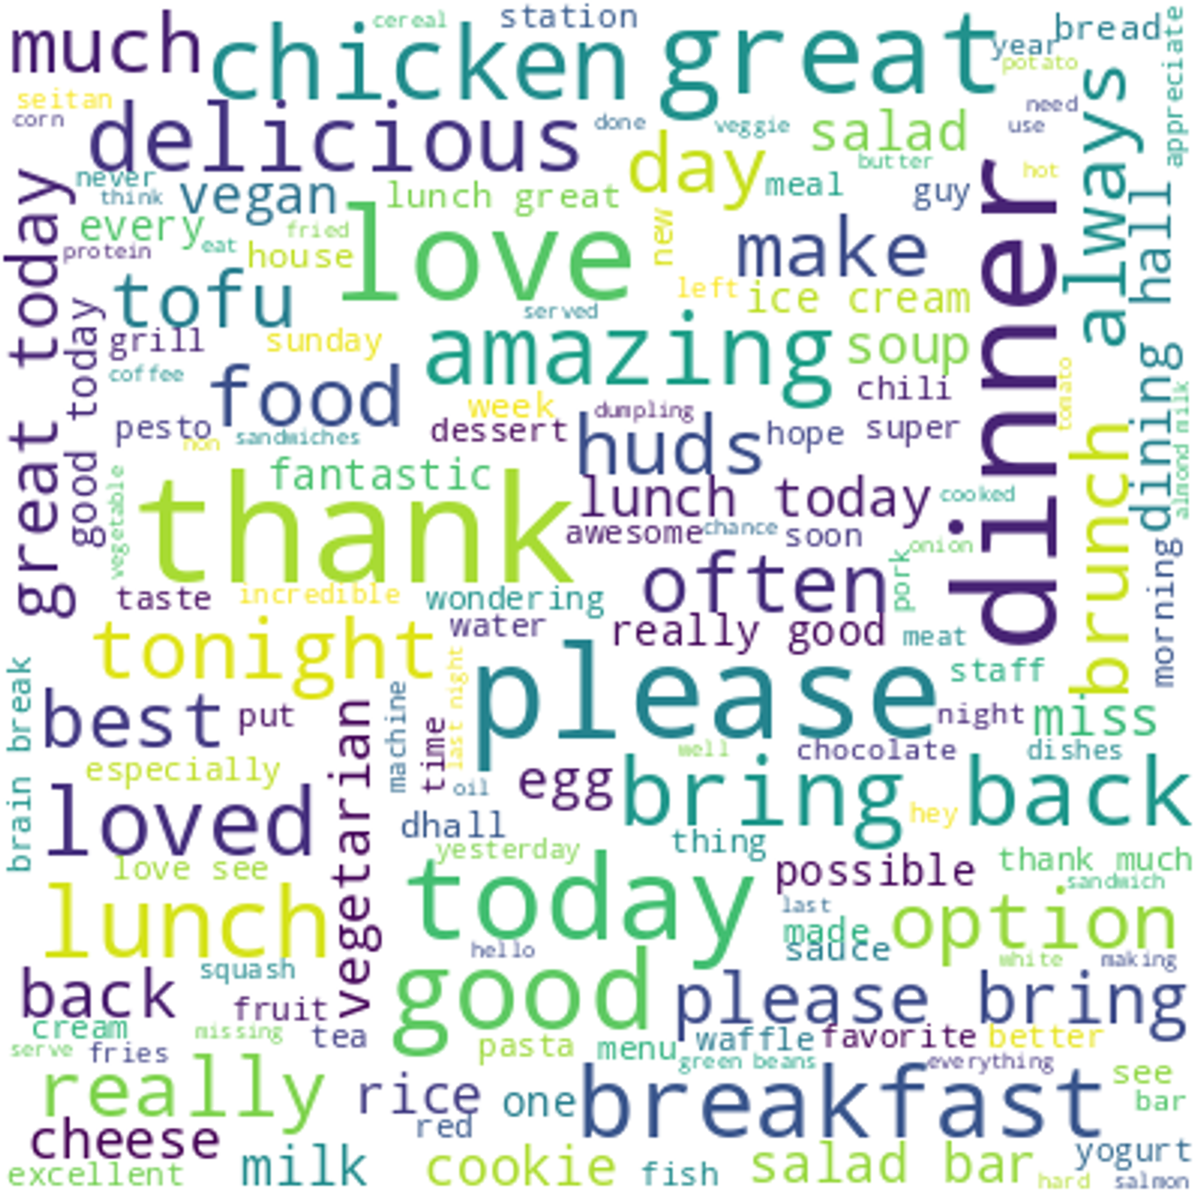 Figure 5
To analyze the raw text itself for visualization, we cleaned up the comment field of the text and tell data, and converted all the words to their root form, as well as correcting common misspellings. From there, we created a WordCloud to see the relative frequency and relationships between the most common words and phrases in the feedback. The abundance of positive terms suggests that positive feedback is often homogeneous in terms of word choice, while negative feedback tends to be more topic specific (Figure 6). However, it is still important to note that the vast majority of the feedback sentiment skews positive overall, and that differences in sentiment within positive feedback don’t factor into the average as much as the difference between positive and negative feedback.
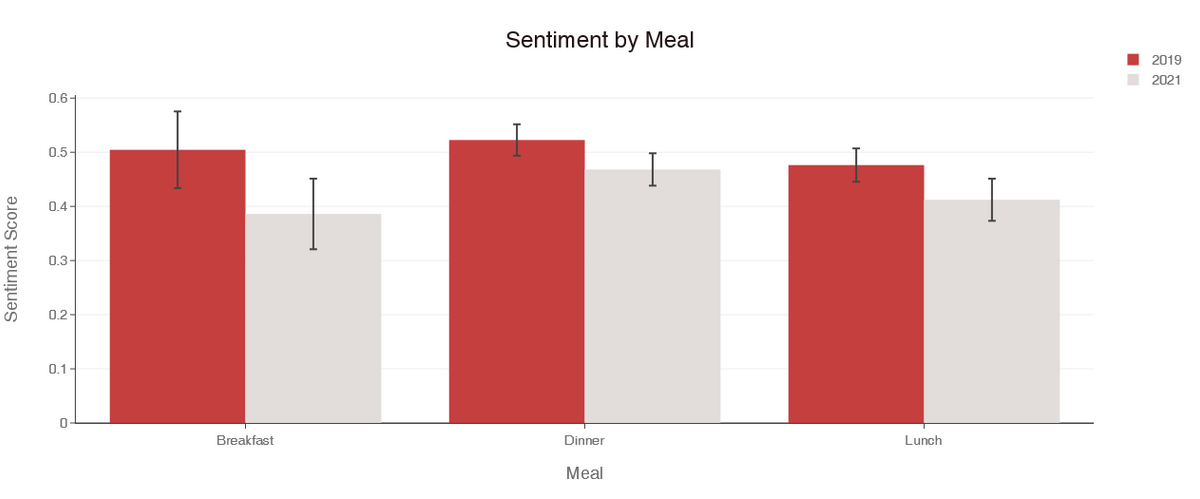 Figure 6
Conclusion, Significance, and Future Work
Across all of these relationships, one common thread was that both the amount of feedback and the overall tone used for feedback changed over the pandemic, while some aspects of student eating habits, such as meal frequency and tastes, remained the same. This represents a cultural shift as a result of roughly half of the student population graduating in the intermediate period.
We would like to acknowledge HUDS Director for Strategic Initiatives & Communications Crista Martin and HODP Internal Relations Director Catherine Huang for their help in obtaining the data used for this analysis.